
Put actuals, budget and forecast side by side. Share the management report and give finance teams insight into the line items behind each variance.
Zaufali nam









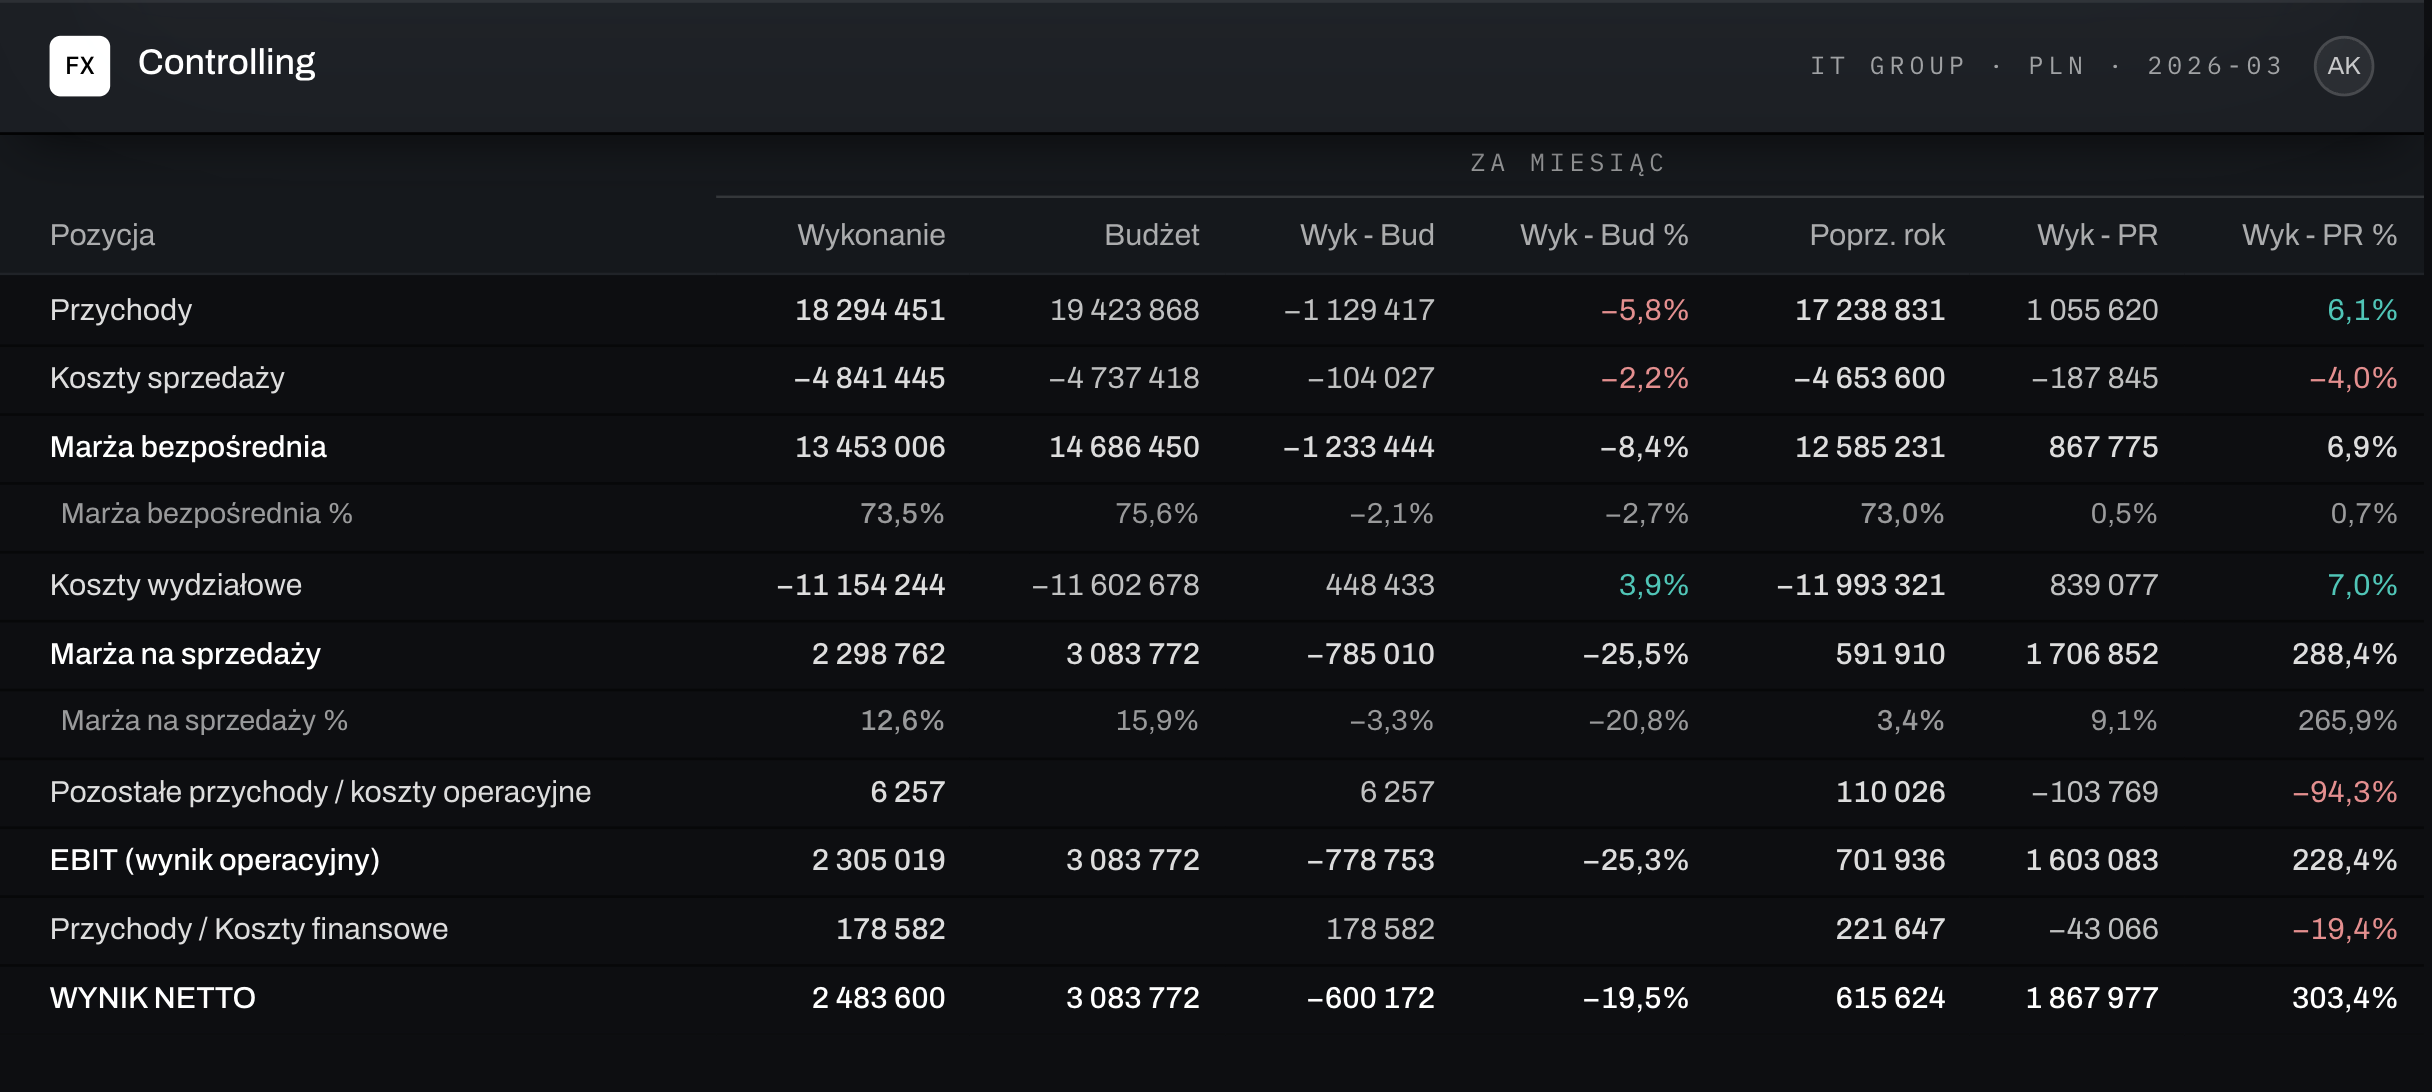
Fincorex® reconciles the period’s data and prepares the management summary automatically. You get results compared with budget and the prior period, cost center reports and commentary on changes – ready to share with the board.
Fincorex® takes you from a variance to its source. From the report you go to the cost center, and then to the accounting entries behind the selected line item – and quickly explain what changed the result.
Compare results with budget and the prior period in one summary. Reports are built on reconciled data, so the board gets consistent numbers without manual copying from Excel.
Learn more →Organize the work and checks needed for the period report. You see which data is already reconciled and which is still waiting, and you move faster from close to results.
Learn more →From a selected report line you go to the accounting entries behind it. You can easily explain a variance and check where a number comes from without searching the accounting system.
Learn more →Show actuals and variances by cost center. Each manager sees the data for their own area in line with their permissions, and controlling has the full picture of the company.
Learn more →The Analyst Agent prepares commentary on changes in results based on the data and writes it into form fields. You review the proposal, edit it and approve it before the report goes out.
Learn more →The board and finance teams work with the same definitions and KPIs.
Compare actuals with the budget, the forecast or the prior period.
Go from results to cost centers and accounting entries within your permissions.
Explain which line items drive the change and prepare commentary for the report’s readers.
Three agents work within your permissions. You can check their proposals and sources before approving any changes.
Analyzes data and writes comments directly into form fields. You can ask for a short summary for the board or a detailed account-level analysis for a manager.
You can repeat the same analysis next period by changing only the date in the prompt.
Example prompt“Comment on the variances between actuals and budget for September.”
Adds accounts, cost centers and users, and changes forms and rules based on your description, e.g. “move a row” or “add a column”.
It also processes data from XLSX files: matches columns, detects errors and duplicates, and asks when something is missing.
Example prompt“Prepare a revenue forecast based on last year’s growth rate.”
Manages applications, models and permissions. Prepares new solutions for you, complete with all the calculation logic.
Example prompt“Create a new model called HR that supports planning per employee.”
You adapt the model, rules and reports to your organization’s structure.
The workspace was designed with Excel-savvy controllers in mind.
Built-in financial logic helps keep the implementation organized.
You change accounts, cost centers and forms within the permissions you have been granted.
“Fincorex® is our main controlling system.”
We report and plan departmental costs, R&D costs by project, as well as capital expenditure. Allocating departmental costs to projects matters to us, and the system supports us here too.
Fincorex® gives us the valuable ability to quickly reorganize reporting structures, such as cost types or cost centers, and makes it easy to enter data into the system – both from Excel and from the web.
Yes. You can show the same data set in a management layout or by cost center, and the level of detail each reader sees depends on their permissions.
From a report line you go to the cost centers responsible for the difference, and from there to the accounting entries that make up that line.
Let’s talk about the process you want to streamline in Fincorex®.
Book a demo