
Translate sales, pricing and cost assumptions into a profit forecast. Compare scenarios and see how operational decisions affect the financial plan.
Volumes, prices and costs as model parameters.
Sales and cost plans linked to the profit forecast.
Growth path forecasts over a multi-year horizon.
Conservative, base and growth scenarios in one model.
Checking how a change in a single assumption affects results.
Operational assumptions translated into revenue, costs and margin.
Actuals used as the starting point for the plan.
Scenario comparison by company, product and project.
Scenario assumptions and results in management board summaries.
With sales of 100,000 units, an increase in variable cost from PLN 62 to PLN 64 per unit lowers the profit forecast by PLN 200k. Prices and fixed costs in this scenario are the same as in the base plan.
PLN · illustrative data
Compare results over the coming years. In this example, the growth scenario exceeds the PLN 2m target in 2027, while the base scenario reaches it in 2029.
Scenarios for 2027–2029 show example result paths. Amounts in PLN.
Connect detailed assumptions for the coming year with goals and decisions for the years ahead.
Translate sales volume, prices and costs into a profit forecast. Match the level of detail to annual decisions.
Compare growth paths over the coming years and see when each scenario will let you reach the target.
Compare results by company, product or project. Choose the breakdowns that match how you make decisions.
Show the management board the result of each scenario and the assumptions behind it. The controller can update the forecast when input data changes.
Data access in line with assigned permissions.
Dashboards and reports based on model data.
Historical and financial data from accounting, ERP and Excel.
Updating assumptions and templates within your permissions.
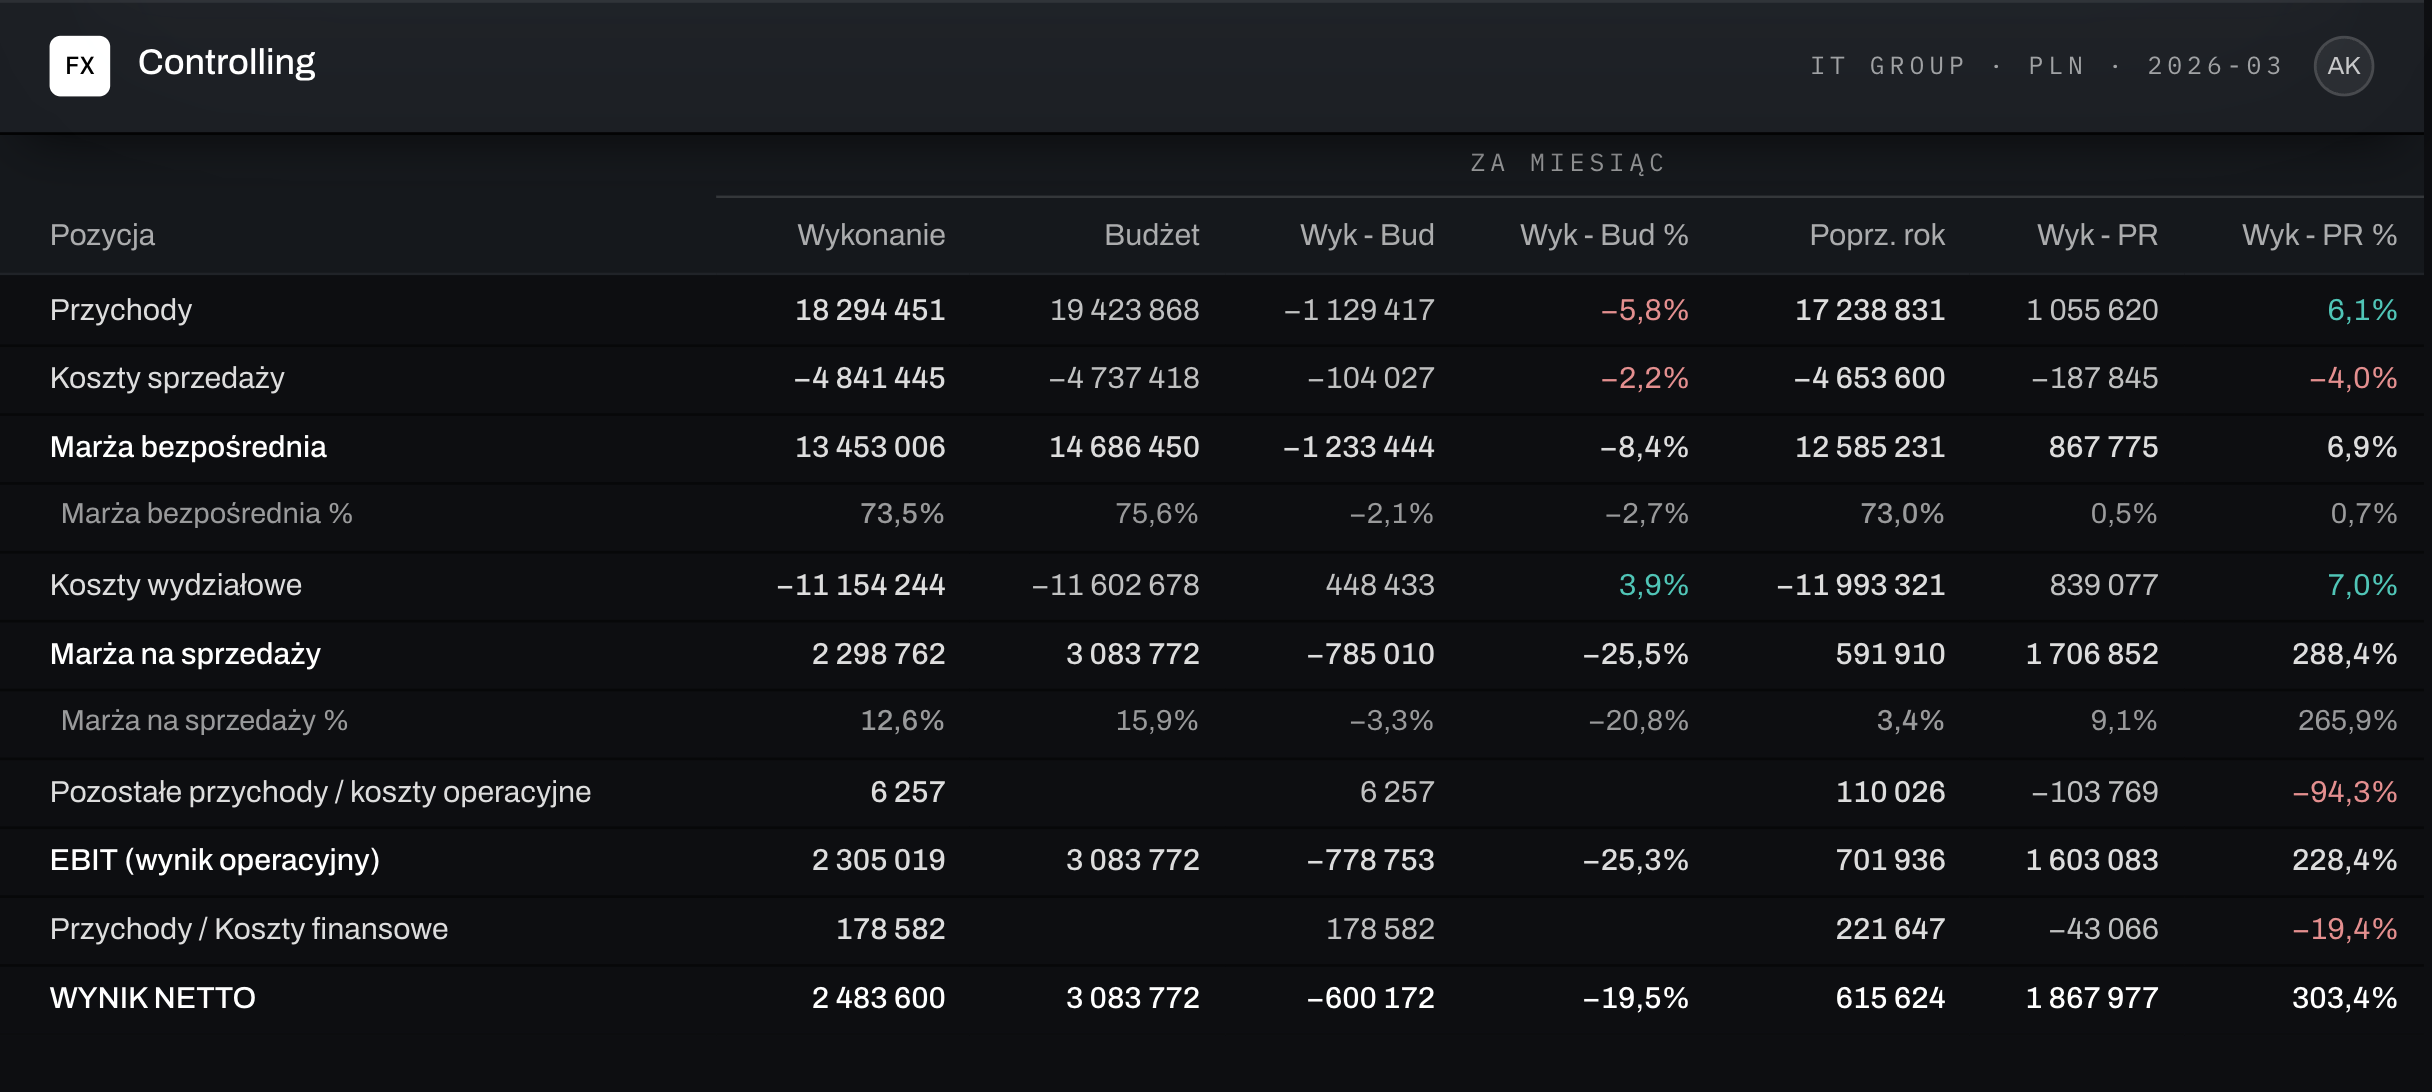
Sample report layout · illustrative data
An operational model translates detailed assumptions – volumes, prices and costs – into a profit forecast for the coming year. A strategic model shows growth paths over a horizon of several years. In Fincorex®, both can use the same data model.
Yes. You can compare the conservative, base and growth scenarios in one summary – year by year and against the target.
Change a selected assumption, e.g. unit cost, and the model recalculates revenue, costs and results. You can compare the effect with the base scenario.
Yes. Historical data from accounting, ERP and Excel is the starting point for the plan, and you can compare actuals with the model assumptions.
Yes. You can tailor assumptions, breakdowns and reports to companies, products or projects – to match how you make decisions.
As a proof of concept, we’ll rebuild your reporting or planning model in Fincorex® and show it to you at our next meeting.
Book a demo