
See what makes up an amount in the report. Drill from the company result through the department and account down to the journal entries available within your permissions.
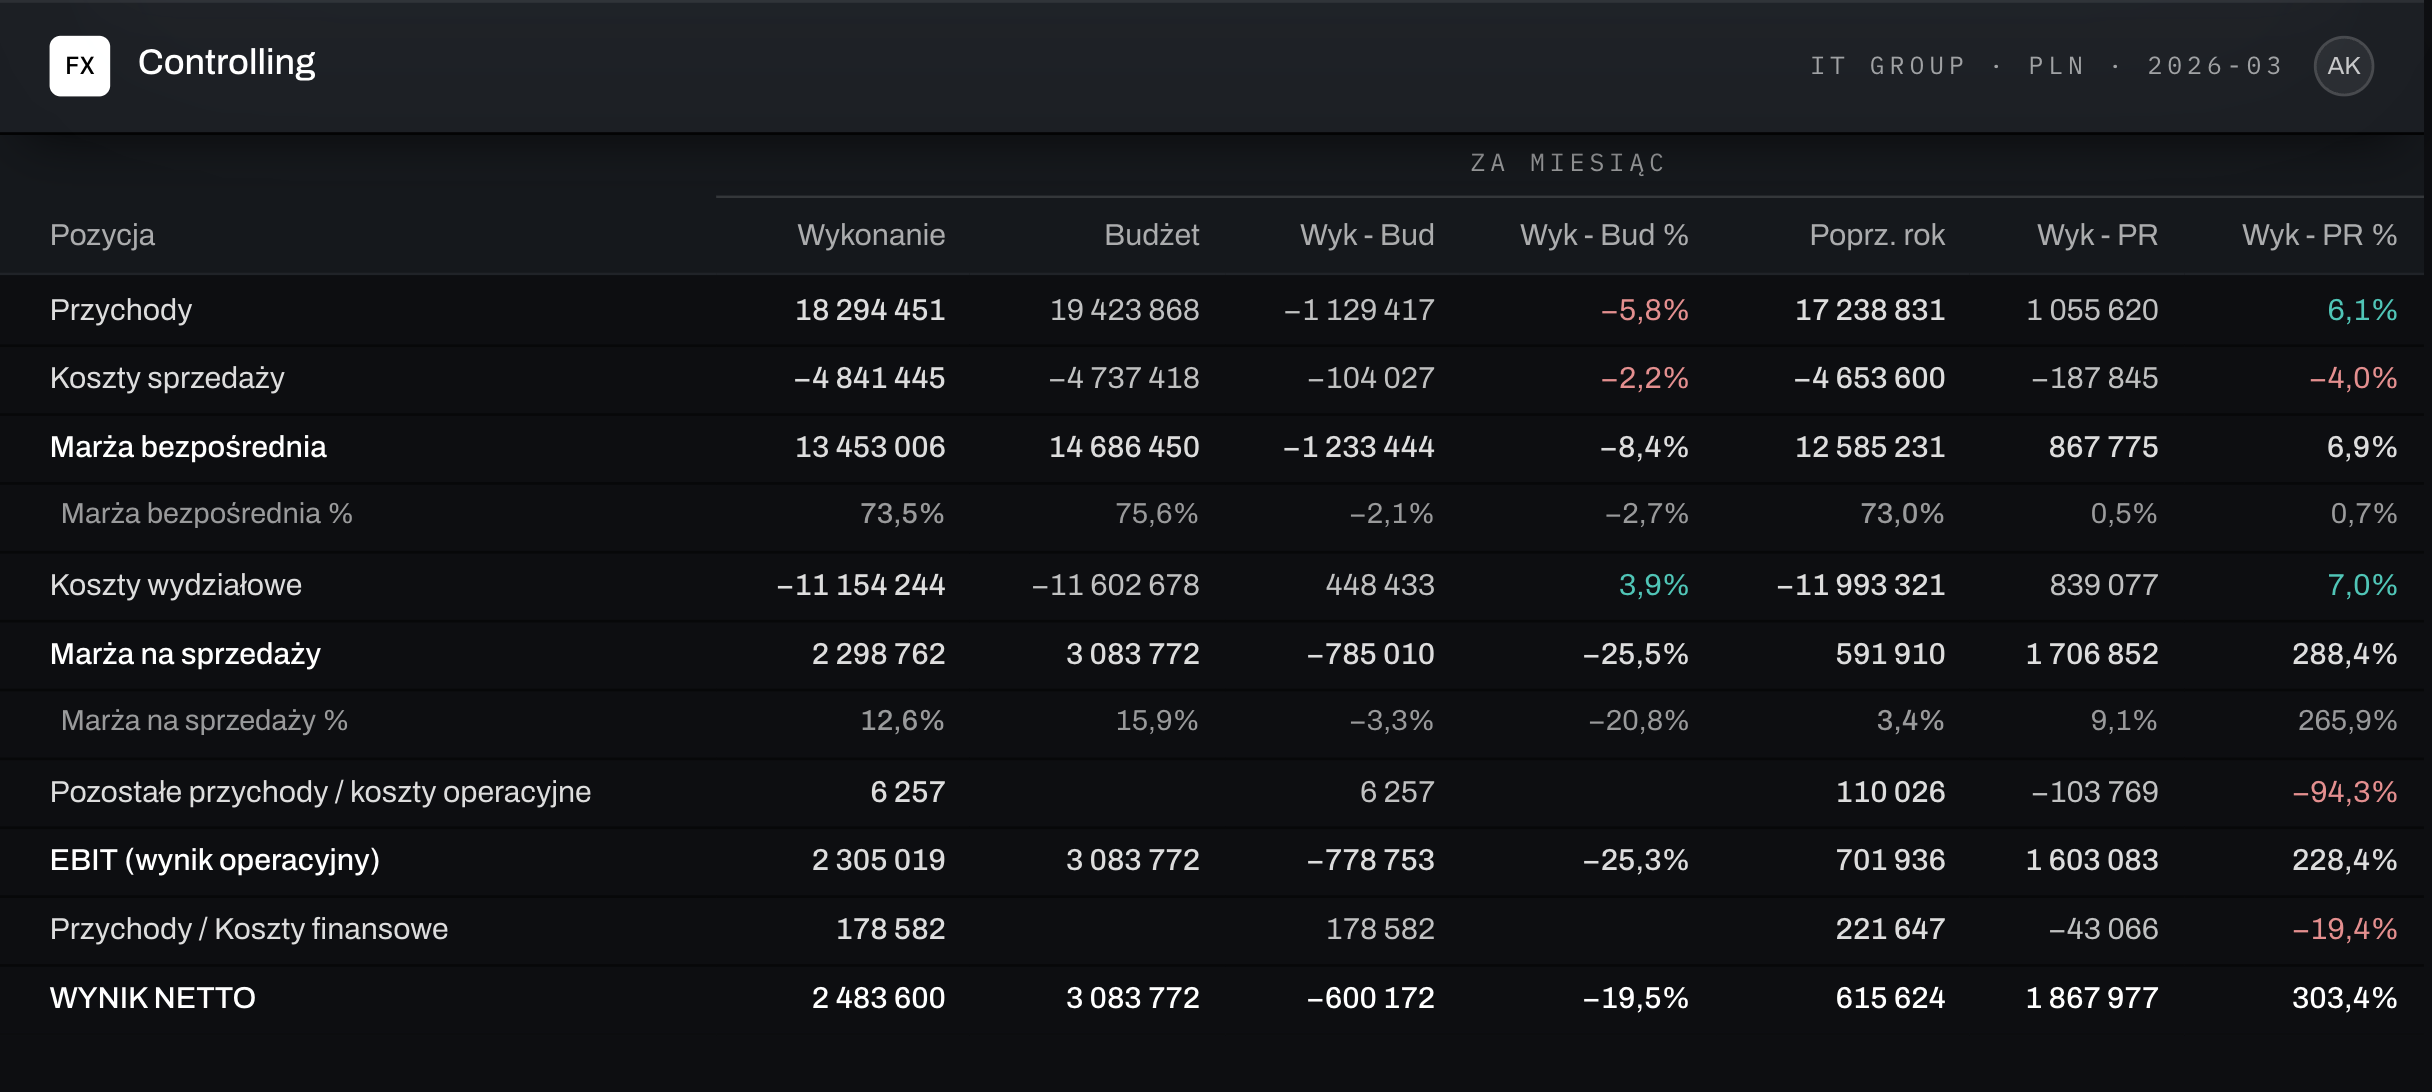
Checking the items that make up an amount in the report.
Analyzing costs by where they are incurred.
Breaking a report line down into the accounts mapped in the model.
Amount, date and document number, where available in the source.
Company, period and cost center as the reference point for details.
Comparing actuals with plan at each level.
Comparing the sum of entries with the reported value.
Level of detail depends on the scope of data integration.
Visibility of reports and details in line with permissions.
Start with the company result. Drill into the costs of a selected department, then into the accounting data. See which items are responsible for the variance from budget.
Example analysis path · PLN · illustrative data
Select marketing services in the Sales cost center. In June, actuals are PLN 200k against a budget of PLN 120k. In the sample data, three entries make up the actuals for this line.
PLN 200k is the sum of the actual entries. The PLN 80k variance comes from comparing this sum with the account budget. Illustrative data.
Keep the company and period context as you move to the next report level.
Start with operating costs and the comparison with budget.
Select the department and cost line that needs explaining.
Check the dates, descriptions and amounts of items available in the source.
Compare the sum of entries with the account amount in the report. The level of detail depends on the data available in the source and the permissions granted.
Data access in line with assigned permissions.
Dashboards and reports based on model data.
Integration of accounting, ERP, sales, HR and Excel data.
Changing accounts, cost centers and templates within your permissions.
Sample report layout · illustrative data
It means moving from an amount in a report to the data it is made of – from the company result, through the cost center and account, down to individual journal entries.
The date, document number, description and amount – to the extent this data is available in the source system.
Yes. At each level you can compare actuals with the budget and identify the accounts and entries responsible for the difference.
Not necessarily. You set access to details by role – the management board can see results, while the controller also sees source entries.
Most often from the accounting or ERP system. The level of detail depends on how the data is integrated with the Fincorex® model.
As a proof of concept, we’ll rebuild your reporting or planning model in Fincorex® and show it to you at our next meeting.
Book a demo