
Monitor profitability, liquidity and debt in Fincorex®. Compare ratios over time and check which financial items are behind the change.
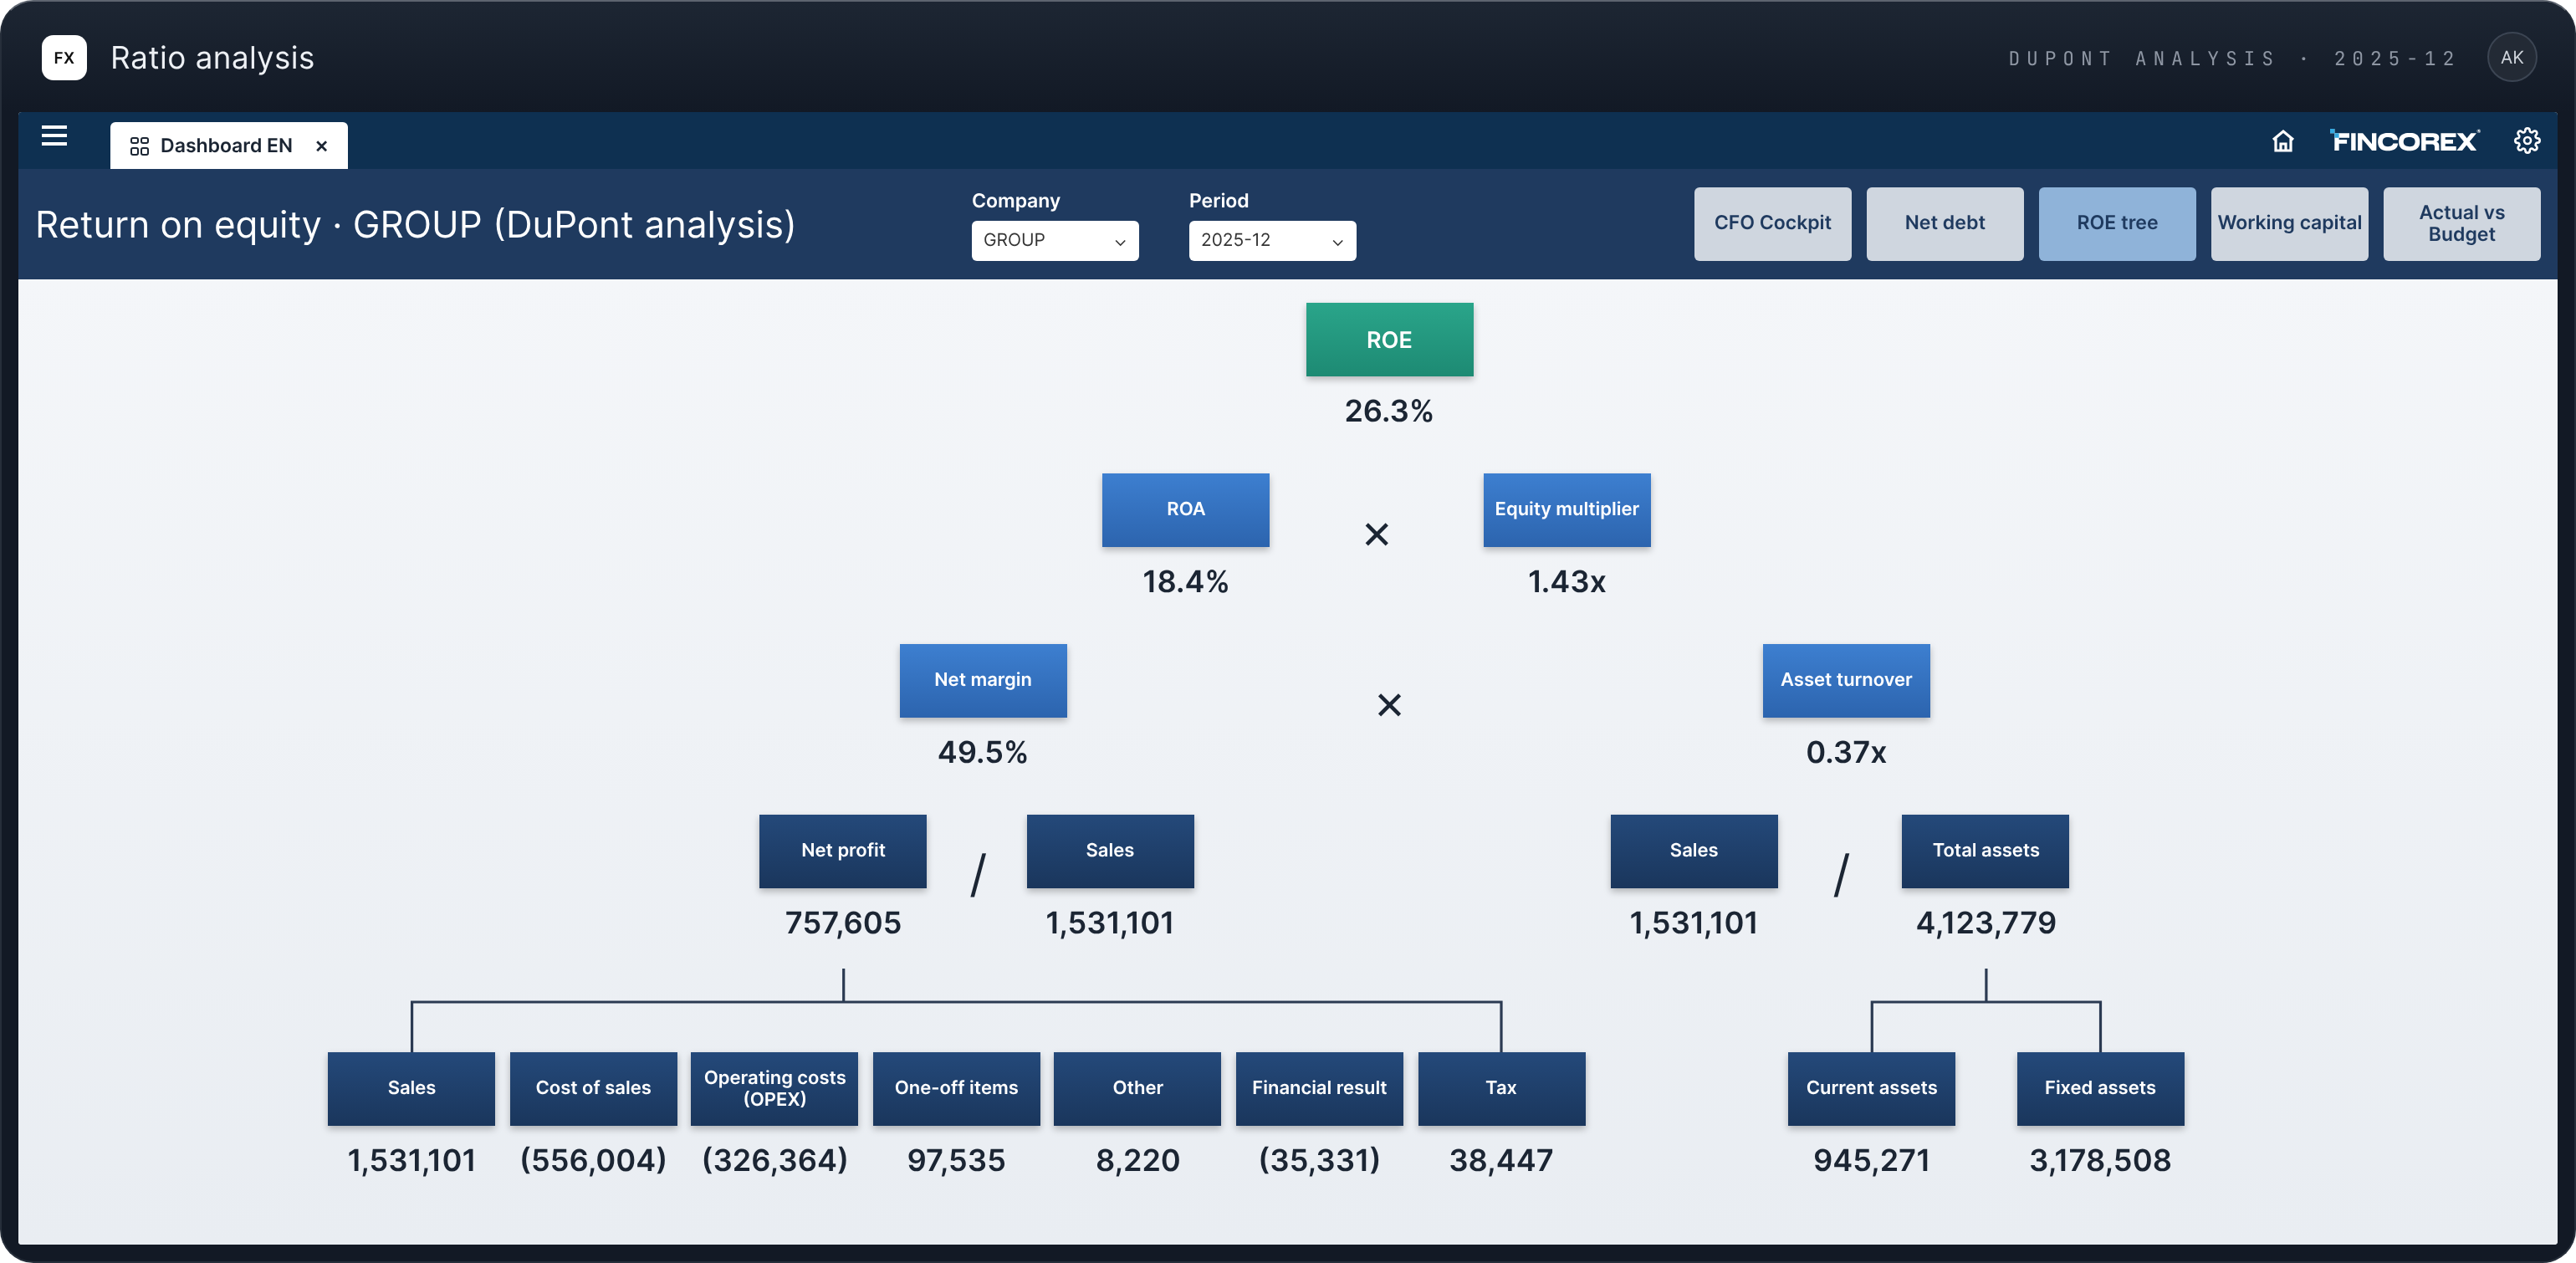
Gross, operating and net margin.
Current assets relative to current liabilities.
The share of liabilities in financing assets.
Comparing liabilities and equity.
Comparing the same KPI over successive periods.
Comparing a ratio with the set target.
Ratios for the group and individual entities.
Visibility into the items used to calculate the KPI.
A set of ratios tailored to the audience.
In December, revenue grew from PLN 12.0m to PLN 12.5m. Cost of sales grew faster, so gross margin fell from 30% to 28%.
Illustrative data
Current assets increased, but current liabilities grew faster. As a result, the current ratio fell from 1.50 to 1.45.
Comparing the numerator and denominator shows why the ratio changed despite the increase in current assets.
See how much of revenue remains after costs.
Compare current assets with current liabilities.
Track the share of liabilities in financing assets.
Define which balance sheet and P&L items go into the calculation. That way, every report reader can interpret the ratio using the same definition.
Formula and component items.
A common reporting date or range.
Company or group.
Prior period or target.
Among others, profitability, liquidity, and debt and capital structure ratios. You can tailor the set of ratios to your company's needs.
Yes. You can compare the same ratio over successive periods, against the prior period or against the set target.
Drill down to the ratio's component items. Comparing the numerator and denominator shows which item is responsible for the change.
Define the ratio: the formula and the balance sheet and P&L items that go into the calculation. That way, every report reader interprets the ratio using the same rule, for the same period and entity.
Yes. You can calculate a ratio for a selected company or for the group and compare it with the prior period or with the set target.
From accounting and ERP systems, sales (CRM) and HR systems, and Excel files. All data goes into one model, so reports and dashboards show the same numbers.
No. Business users can build reports, analyses and dashboards themselves – without knowing complex IT tools. This makes them more independent and shortens the time it takes to get to key information.
As a proof of concept, we’ll rebuild your reporting or planning model in Fincorex® and show it to you at our next meeting.
Book a demo