
Compare the investment budget with the spending incurred. Update the estimate at completion and see which projects may exceed the plan.
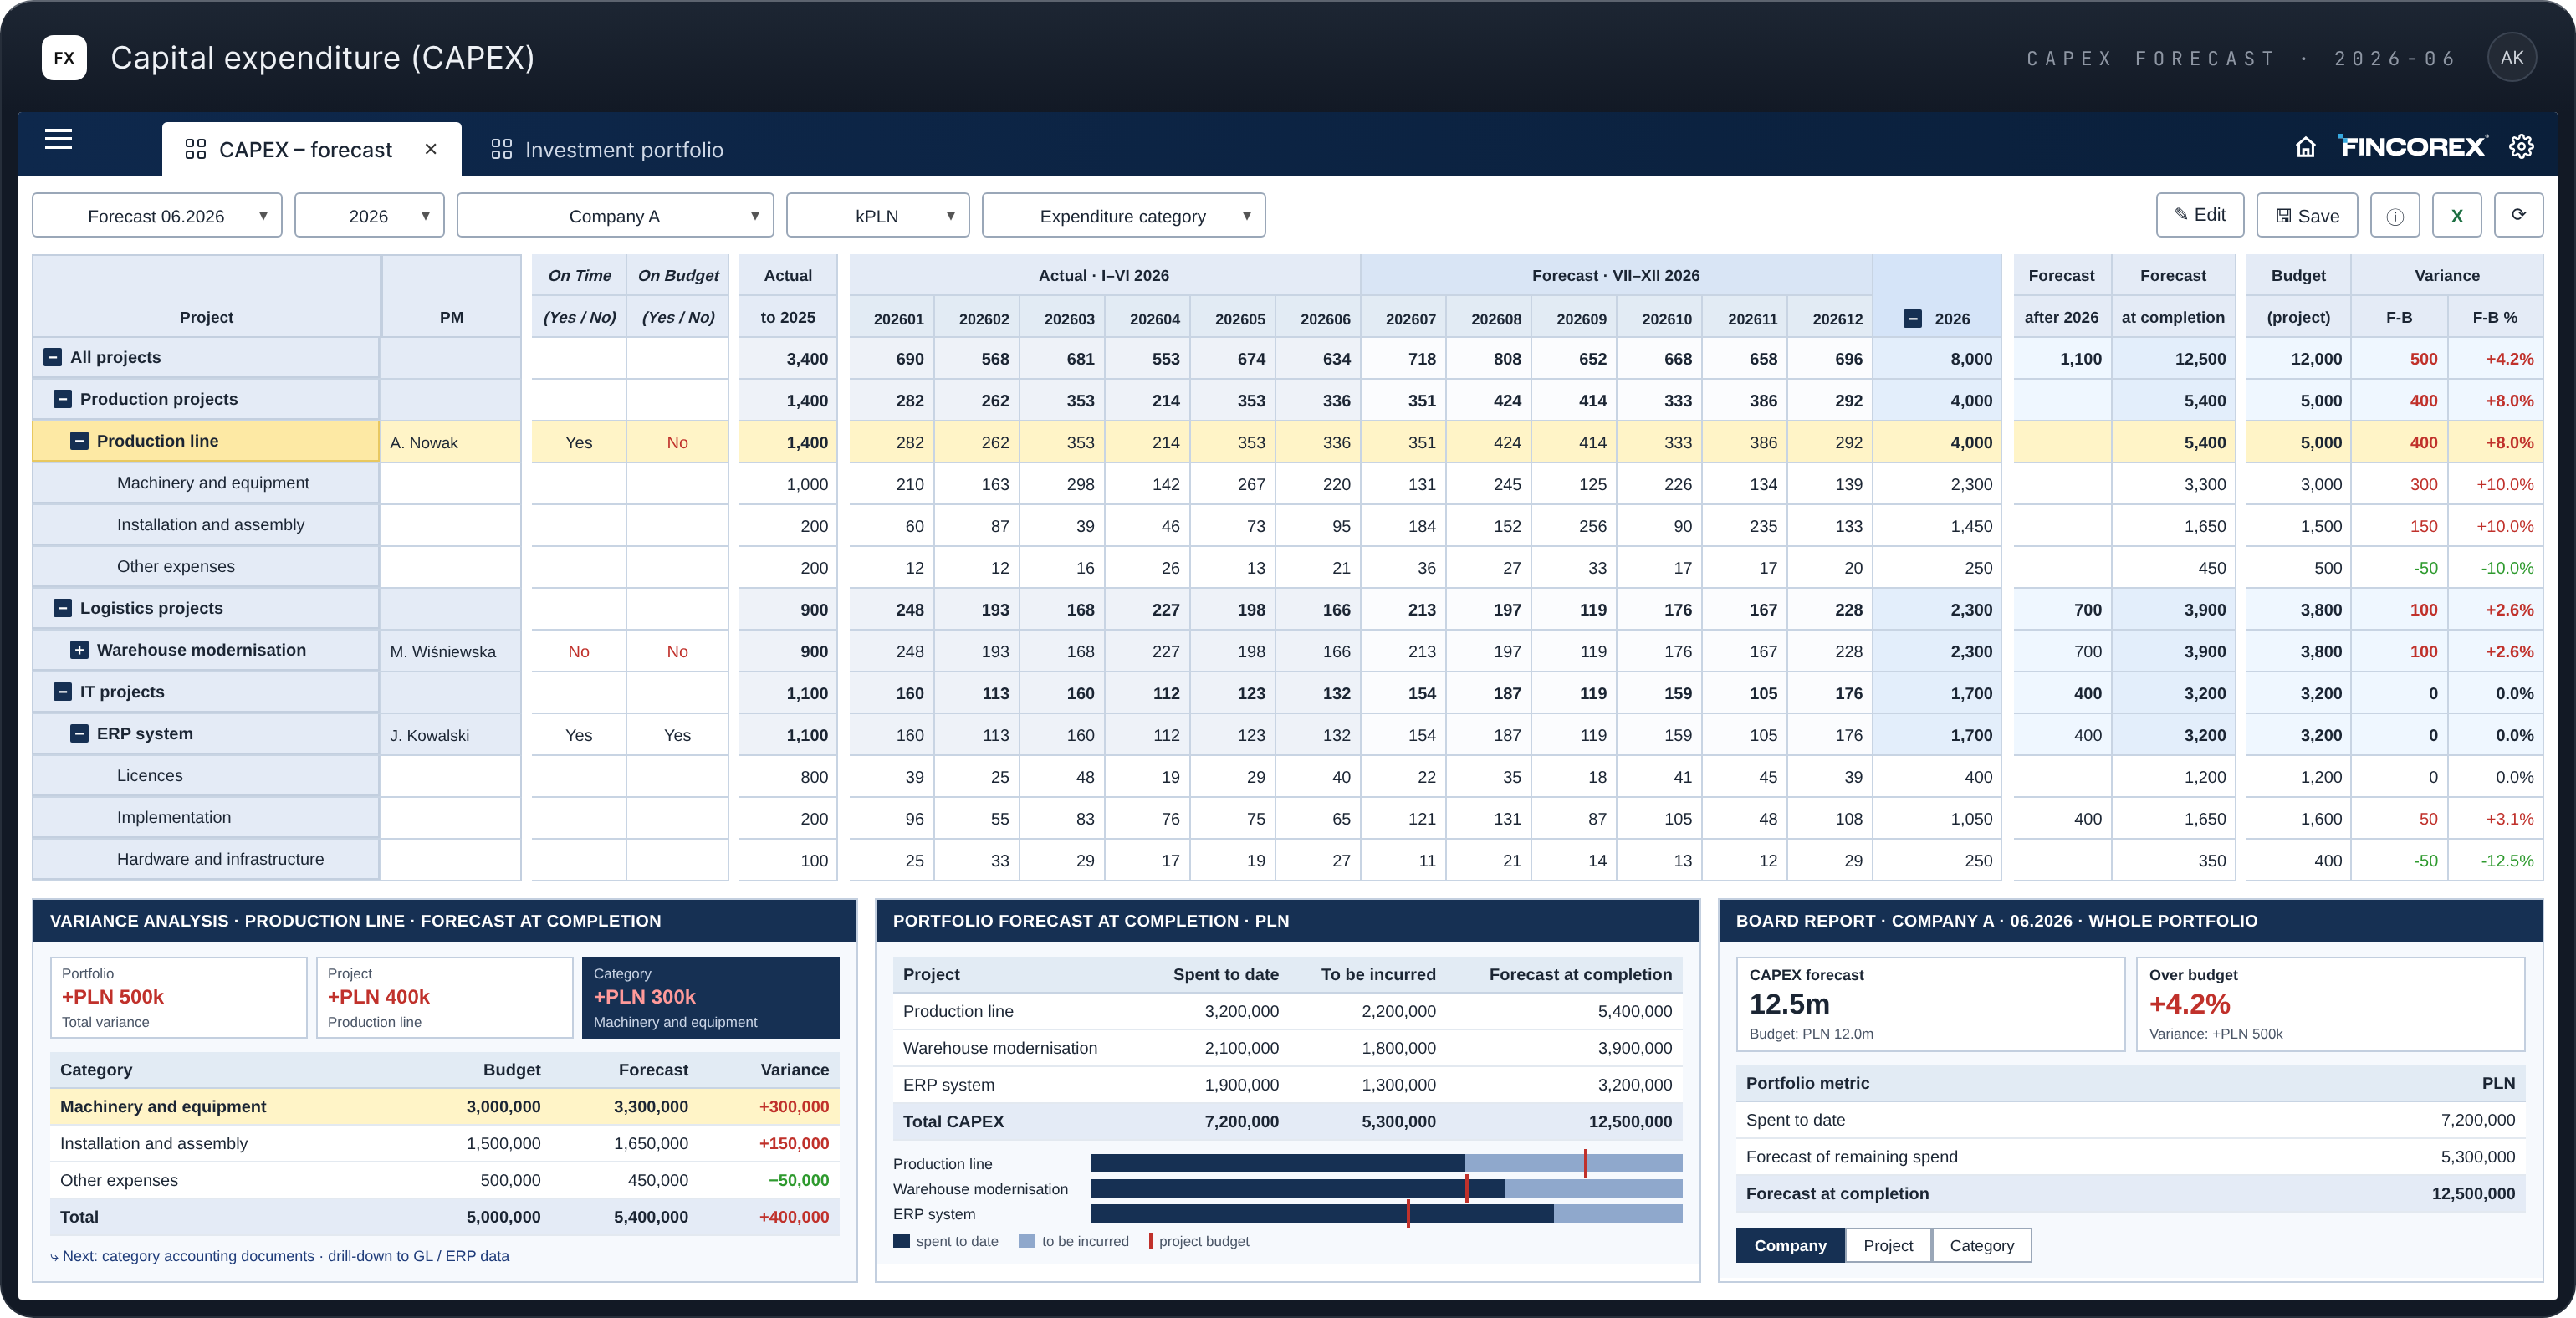
Spending and forecasts for each project in one view.
Spending plan by project, period and category.
Spending incurred, based on accounting data.
Spending to date plus expected spending until the project ends.
Differences between budget and forecast in amounts and percentages.
From the project to cost categories and accounting data.
Comparison of the budget and the current forecast.
Projects by company and currency in the investment model.
Statements for the management board and controllers, with permissions applied.
Go from the variance of the whole portfolio to the project and spending category. In this example, the production line forecast is PLN 400k above budget.
PLN · illustrative data
The estimate at completion combines spending to date with the expected spending until completion. Compare it with the budget and see where the plan needs updating.
For the portfolio we forecast PLN 12.5m at completion vs. a budget of PLN 12.0m. Illustrative data.
Compare scenarios and periods. Match reporting breakdowns to the structure of your organization and the responsibilities of each audience.
Set results against the plan. Check variances and take them into account when working on the next forecast.
Check spending for a selected period and year-to-date. Compare data with the same period of the prior year.
Analyze spending by company, project and investment category. Fit the model to the way you manage the business.
Prepare reports and dashboards on a shared data model. The management board sees the spending forecast and the risk of exceeding the budget, while the controller analyzes the details as needed.
Access to data according to assigned permissions.
Dashboards and reports based on model data.
Project and financial data from accounting, ERP and Excel.
Changes to projects, accounts and templates within your permissions.
Sample report layout · illustrative data
The budget, spending incurred and estimate at completion for each project and the whole portfolio – in amounts and percentages, with the variance from plan.
The forecast combines spending to date, taken from accounting data, with expected spending until the project is completed. The controller updates the estimate, and the model immediately shows the variance from budget.
Yes. The investment portfolio shows projects from all companies in one view, and you can filter reports by company, project and spending category.
Yes. The model handles projects in different currencies and lets you report them by company and in the group currency.
Yes. From a project you go to spending categories, and from there to detailed accounting data.
As a proof of concept, we’ll rebuild your reporting or planning model in Fincorex® and show it to you at our next meeting.
Book a demo