
Connect Power BI directly to the Fincorex® model. Use actuals, budget and forecast data in visualizations tailored to the report's audience.
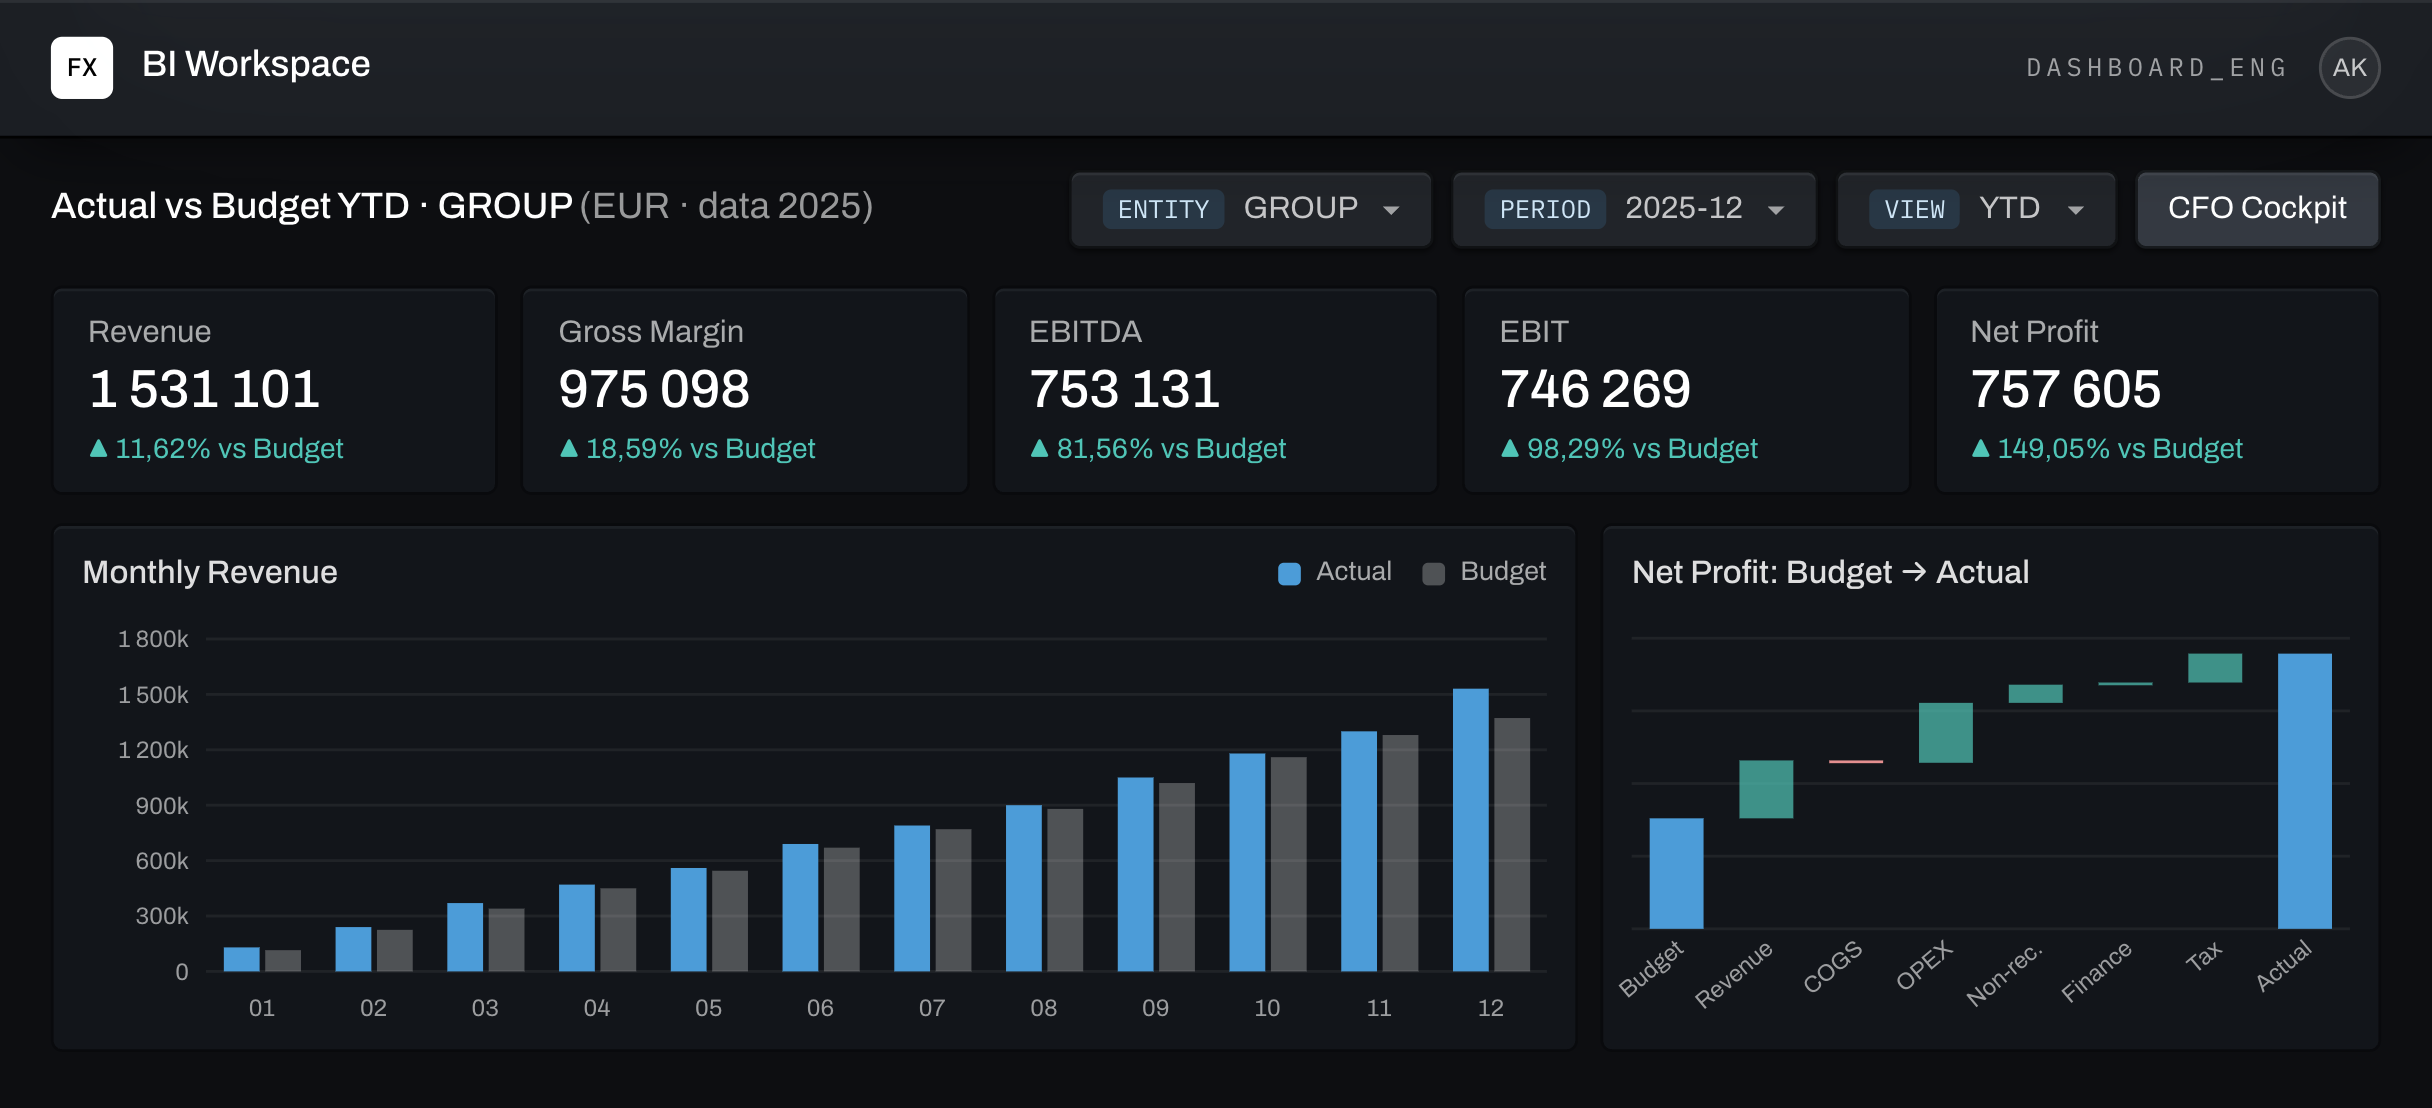
The Fincorex® model as a data source for Power BI.
Financial and operational results within the model's scope.
Actuals, budget and forecast in one view.
Trend charts, KPI cards and comparison tables.
Monitoring margin, profitability and liquidity.
Analysis by company, region and product.
Breaking a difference down into the areas that make it up.
From the aggregated amount to the underlying data.
Combining Fincorex® data with other data in Power BI.
In a Power BI report, we put actuals and budget from the Fincorex® model side by side. Group revenue is PLN 400k below plan. The regional breakdown shows that the largest variance occurred in the South.
Revenue · PLN m · illustrative data
In the South region, the largest variance is on product A. Its sales were PLN 450k below plan, which is 75% of the region's gap.
The breakdown shows which products to start with when analyzing the causes of lower sales.
Define the items, periods and scenarios the report needs.
Use the connector to make Fincorex® data available in Power BI.
Choose charts, filters and breakdowns for the report's audience.
In Power BI you can put revenue and margin from the Fincorex® model alongside volume from the sales system. In this example, the data is joined by product and period.
Revenue, costs and margin.
Volumes and sales breakdowns.
A consistent scope for reports and comparisons.
A shared product and reporting period identifier.
Revenue in PLN · illustrative data
It connects Power BI directly to the Fincorex® model. Actuals, budget and forecast data reach Power BI without manual exports.
Yes. Actuals, budget and forecast from the Fincorex® model can go into one Power BI report, together with a breakdown by region or product.
Yes. In Power BI you can combine Fincorex® data with other organizational data, e.g. volume from the sales system, and build your own dashboards.
In Power BI. Fincorex® is the data source, and you choose the charts, filters and breakdowns in Power BI for the report's audience.
Yes. The connector makes Fincorex® data available in real time, without manual exports, so the Power BI report uses current model data.
Yes. Fincorex® BI supports automatic conversion of Power BI reports, so you don't have to rebuild them from scratch.
It depends on the number of data sources and the reporting scope. The first reports and dashboards can be up and running within a few weeks – we'll agree on the details at a meeting.
As a proof of concept, we’ll rebuild your reporting or planning model in Fincorex® and show it to you at our next meeting.
Book a demo