
Bring results, margins and key metrics together in a management board report. Compare actuals with the budget and the prior year, and check the causes of variances in the detailed data.
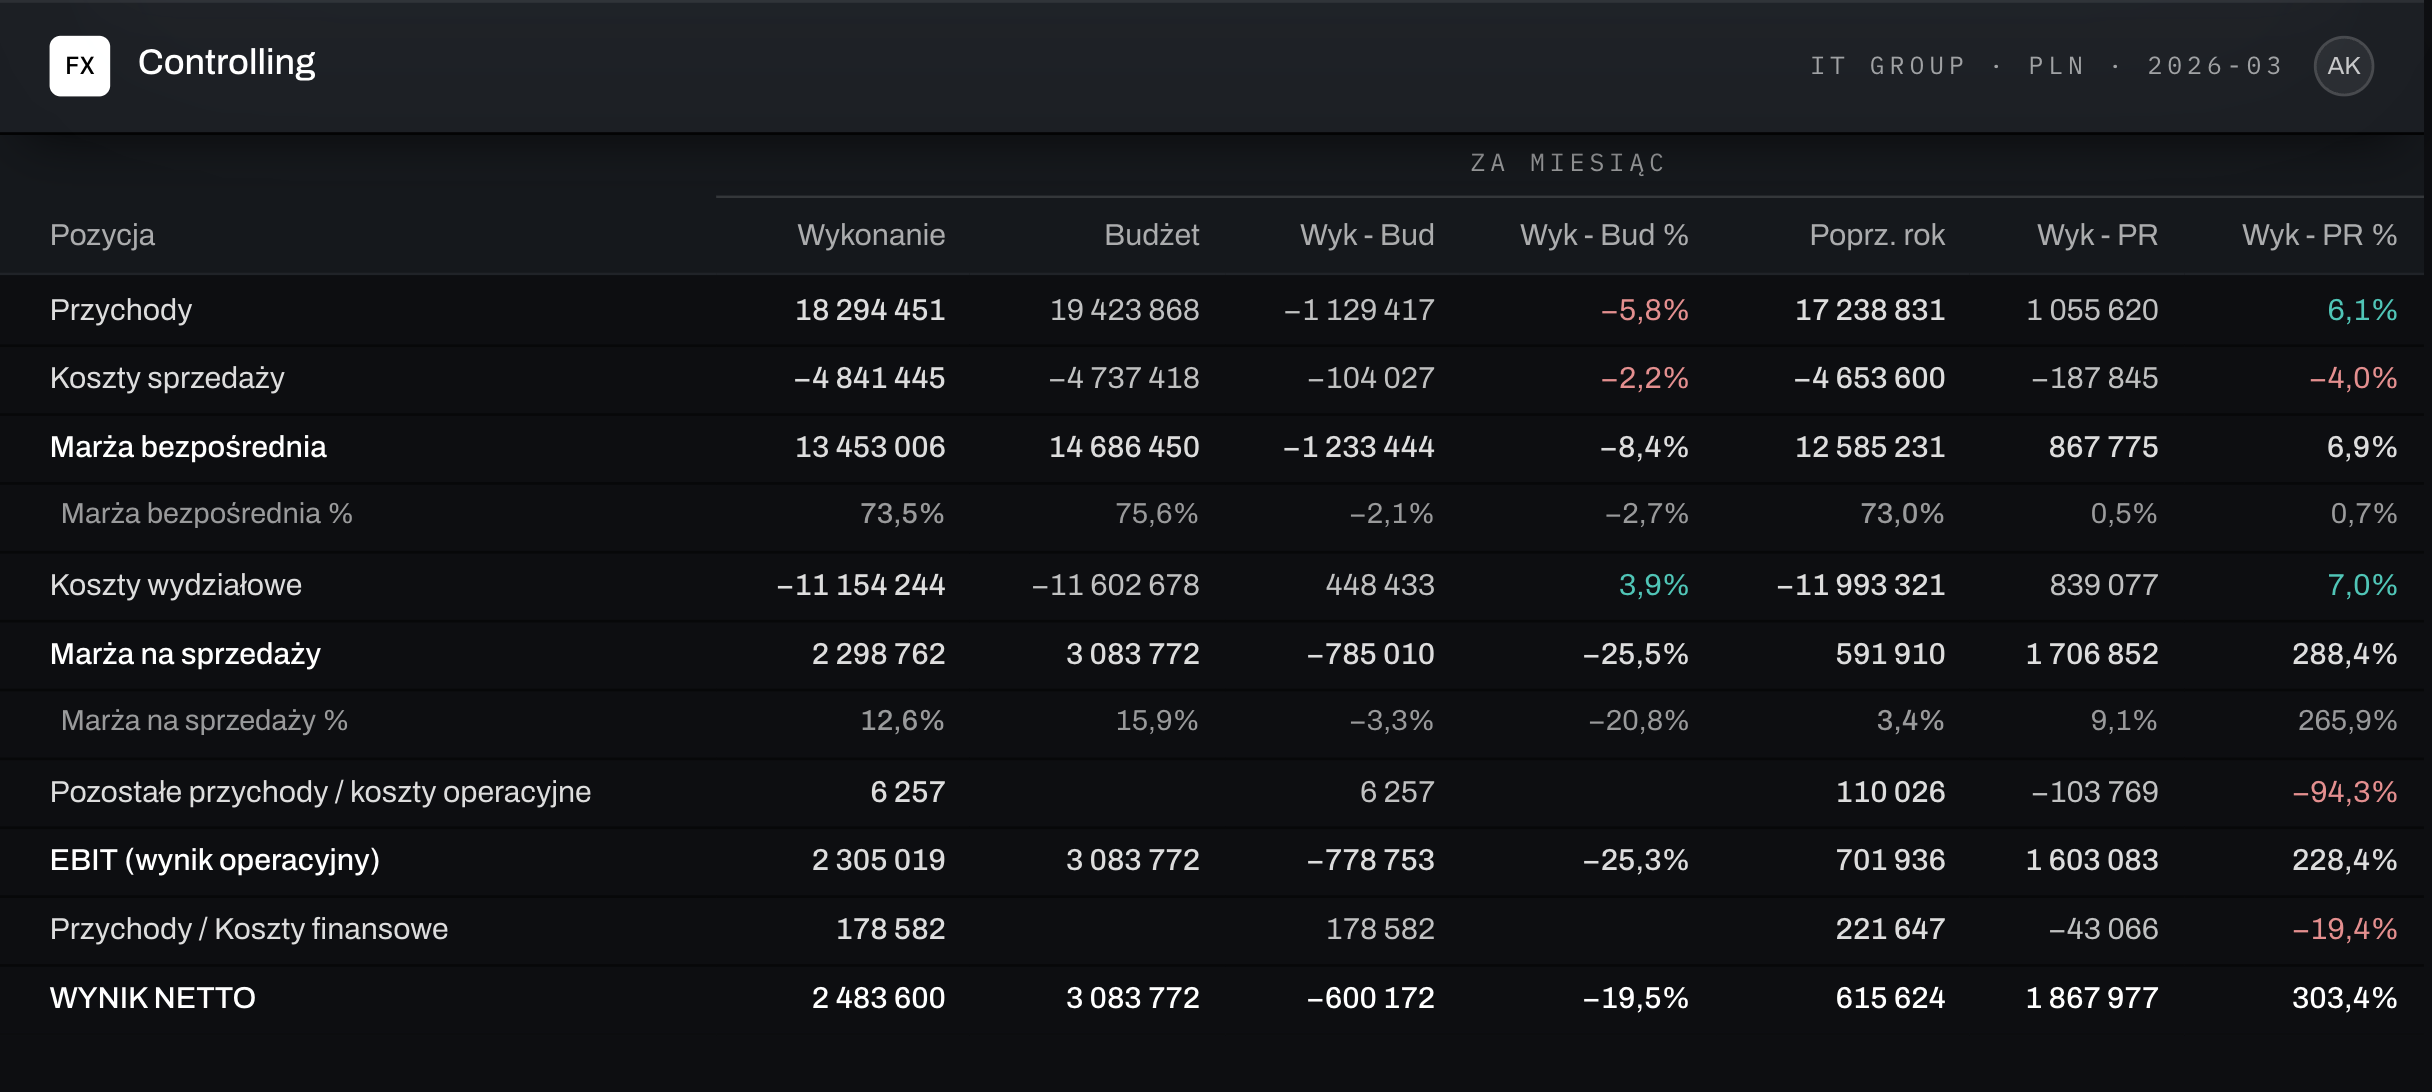
Results, revenue, costs and margins in one summary.
Metrics chosen to match how you manage the company.
Comparing results with the budget and forecast.
Month, year-to-date and prior-year views.
Differences in amounts and percentages, and their sources.
From results down to accounts and source data.
Views for the management board, controllers and department managers.
A shared data model from accounting, ERP and other sources.
Metrics and reports based on model data.
Start with the company result. Drill into the costs of a selected department, then into the accounting data. See which items are responsible for the variance from budget.
Example analysis path · PLN · illustrative data
Revenue is PLN 500k above budget, but EBITDA is PLN 200k lower. Higher direct costs offset the revenue surplus, and rising operating costs reduced the result.
Monthly report · June 2026 · illustrative data
For further analysis, select operating costs by department. In this example, the sales department accounts for PLN 120k of the PLN 200k variance.
Compare scenarios and periods. Match reporting breakdowns to your organizational structure and each audience's scope of responsibility.
Set results against the plan. Check variances and take them into account when working on the next forecast.
Check the result for a selected period and year-to-date. Compare it with the same period of the prior year.
Analyze data by company, department, cost center and project. Tailor the model to how you manage the company.
Build reports and dashboards on a shared data model. The management board sees results and key metrics, while the controller analyzes line-item details.
Data access in line with assigned permissions.
Dashboards and reports based on model data.
Integration of accounting, ERP, sales, HR and Excel data.
Changing accounts, cost centers and templates within your permissions.
Sample report layout · illustrative data
Results, revenue, costs, margins and key metrics – in a layout tailored to how you manage the company, compared with the budget.
Yes. The report sets out actuals, budget, forecast and the same period of the prior year – for the month and year-to-date.
Yes. From a report line you can go to the cost centers, accounts and entries available in the source system.
No. You set views and data scope by role – different ones for the management board, controllers and department managers.
Yes. Data from accounting, ERP, sales, HR and Excel flows into a shared model used by all reports.
As a proof of concept, we’ll rebuild your reporting or planning model in Fincorex® and show it to you at our next meeting.
Book a demo