
Fincorex® BI is a modern analytics tool: from data integration to clear reports and dashboards that support decisions.
Zaufali nam









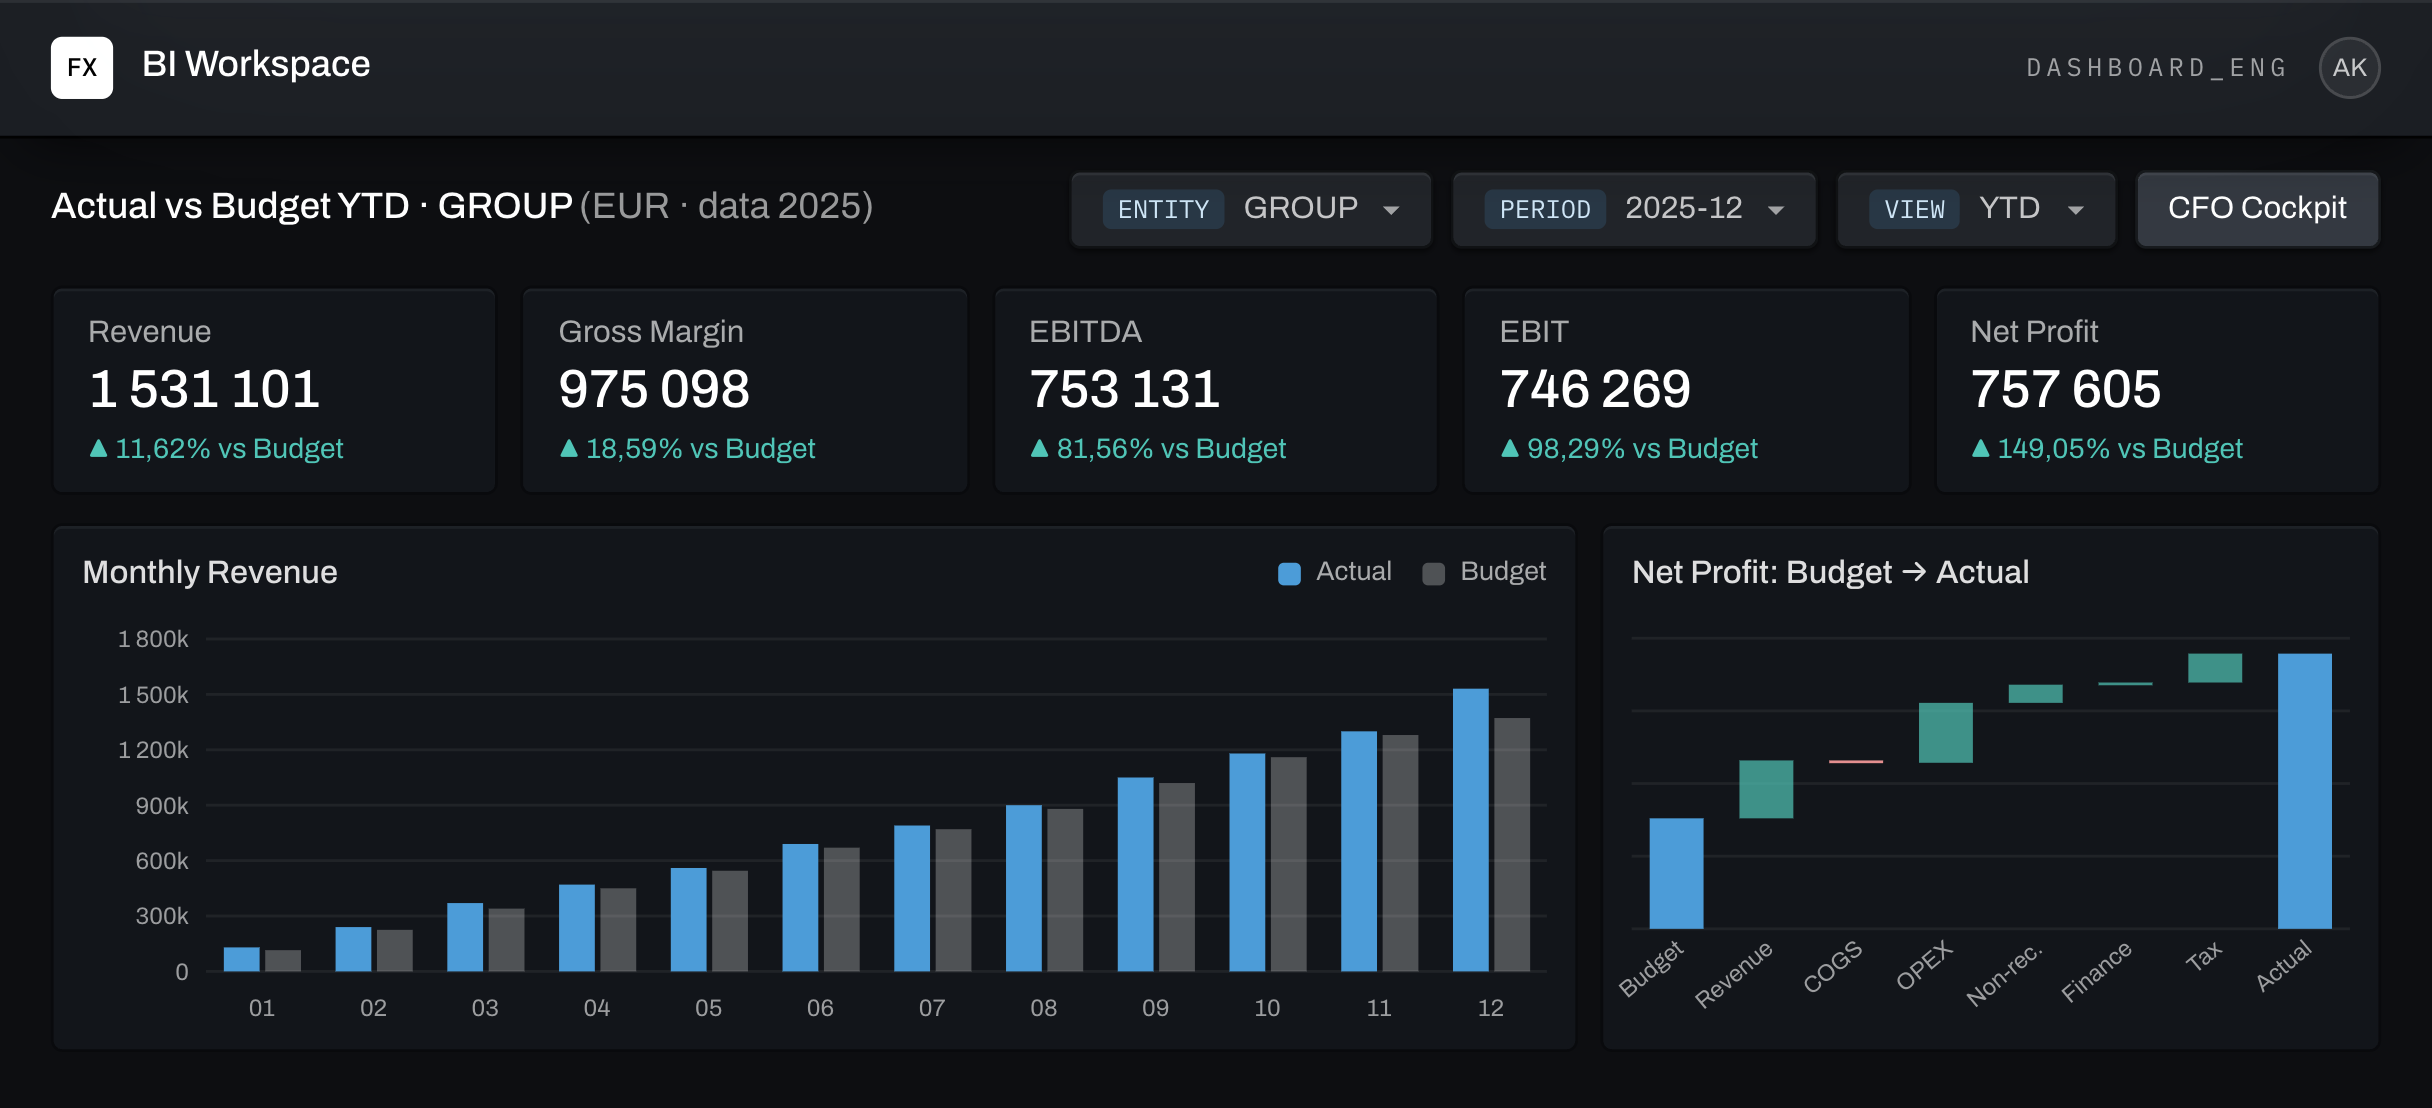
Fincorex® BI gathers data from different areas of the company in one place and turns it into clear reports and dashboards. You react faster to market changes, see trends and make sound business decisions – without preparing summaries by hand.
Our BI solutions let you create reports and analyses without knowing complex IT tools. This makes business users more independent and shortens the time it takes to get key information.
Fincorex® BI lets you create and monitor many financial ratios covering areas such as profitability, liquidity, and debt and capital structure.
Fincorex® BI has built-in tools for advanced data analytics that let you quickly discover patterns and relationships in your business. They make decision-making more precise and fact-based.
We built our own Power BI connector that integrates data from Fincorex® BI directly and reports it in real time. This makes it easier to combine it with other company data and build advanced dashboards and analyses tailored to your needs.
„We implemented Fincorex® for our financial reporting process and sales data by SKU and customer, within weeks!”
The system is now a key decision-making tool in the management of financial and planning information for our business activities. It centralizes and manages the information from our organization’s ERP Priority system, creating an accounting and financial management reporting process in a uniform language, for Actuals, Forecast and Budget.
A huge thank you on behalf of the Remedix-Care management team.
No. Business users can prepare reports, analyses and dashboards themselves – without knowing complex IT tools. This makes them more independent and shortens the time it takes to get key information.
From finance and accounting systems and ERPs, sales (CRM) and human resources (HR) systems, and Excel files. All data goes into one model, so reports and dashboards show the same numbers.
Among others, profitability, liquidity, and debt and capital structure ratios. You can tailor the set of ratios to your company’s needs.
Yes. Our Power BI connector makes Fincorex® BI data available in real time, without manual exports. You can combine it with other company data and build your own dashboards.
Yes. Fincorex® BI can convert Power BI reports automatically, so you don’t have to rebuild them from scratch.
It depends on the number of data sources and the scope of reporting. The first reports and dashboards can be up and running within a few weeks – we’ll agree on the details at a meeting.
As a proof of concept, we will recreate your reporting or planning model in Fincorex® and show it to you at our next meeting.
Get in touch