
Collect the data for the month being closed, check that it is complete and explain any differences. Prepare the management report on reconciled data.
Data from accounting, ERP and other sources aligned to the same period.
Checking that the model covers the required sources and report areas.
Comparing model data with source summaries.
Explaining discrepancies by account, cost center and category.
From a difference in the report to the source items.
Checking the result after data or mapping is completed.
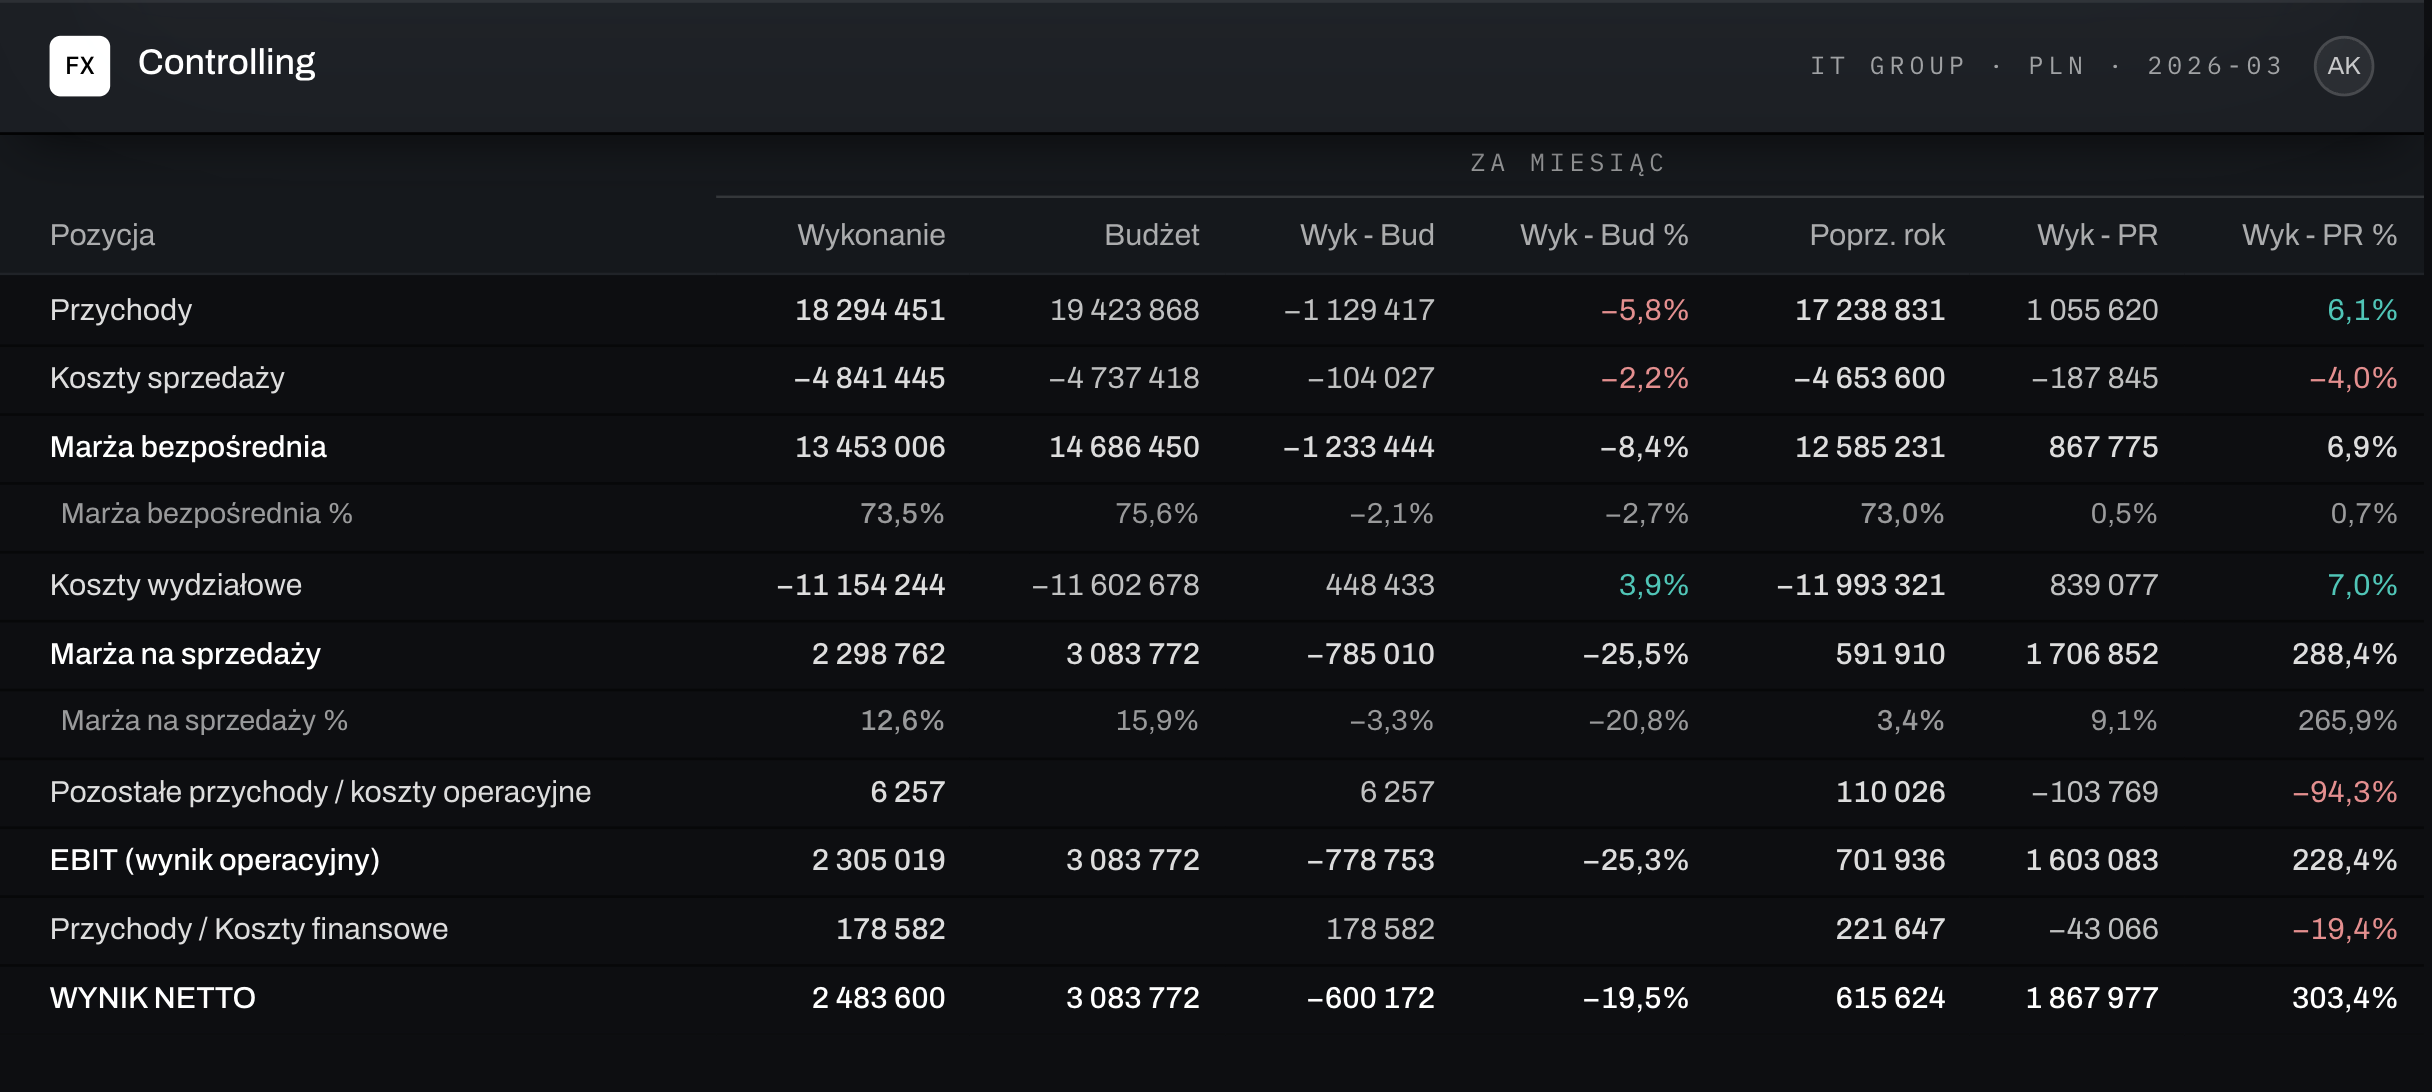
Revenue, costs and margins after the checks.
Budget, actuals and prior year in the same layout.
Views tailored to roles and permissions.
In this example, total operating costs in the model are lower than in the accounting system. Analysis by cost center shows that the difference relates to marketing services in the sales department.
PLN · illustrative data
Check that the sources cover the same period, the data is complete and the control totals match. After completing the mapping, recalculate the result.
Reconciling data before reporting puts the period result in order and makes variance analysis easier. Illustrative data.
Repeat the same set of checks in each period.
Load the model with data for the period being closed. Check the sources and data dates.
Compare control totals and drill into accounting details.
Set the monthly result against the budget and share the report with authorized recipients.
Once the data is reconciled, set the monthly result against the budget and the prior year. The controller can drill from a variance to the source items.
Data access in line with assigned permissions.
Dashboards and reports based on model data.
Integration of accounting, ERP, sales, HR and Excel data.
Changing accounts, cost centers and templates within your permissions.
Sample report layout · illustrative data
Loading the model with data for the period being closed, checking completeness and totals, explaining differences and preparing the report on reconciled data.
Compare control totals with accounting data, then drill into the cost centers, accounts and source items that make up the difference.
Yes. You can bring together data from accounting, ERP and other systems in the model for the same period.
Run the check again. The model recalculates the result and shows whether the differences have been explained.
Yes. You can set the monthly result against the budget and the prior year in the same report layout.
As a proof of concept, we’ll rebuild your reporting or planning model in Fincorex® and show it to you at our next meeting.
Book a demo