
Combine financial and operational data in one model. In Fincorex® BI you can compare results with the budget, see trends and check which areas drive the variance.
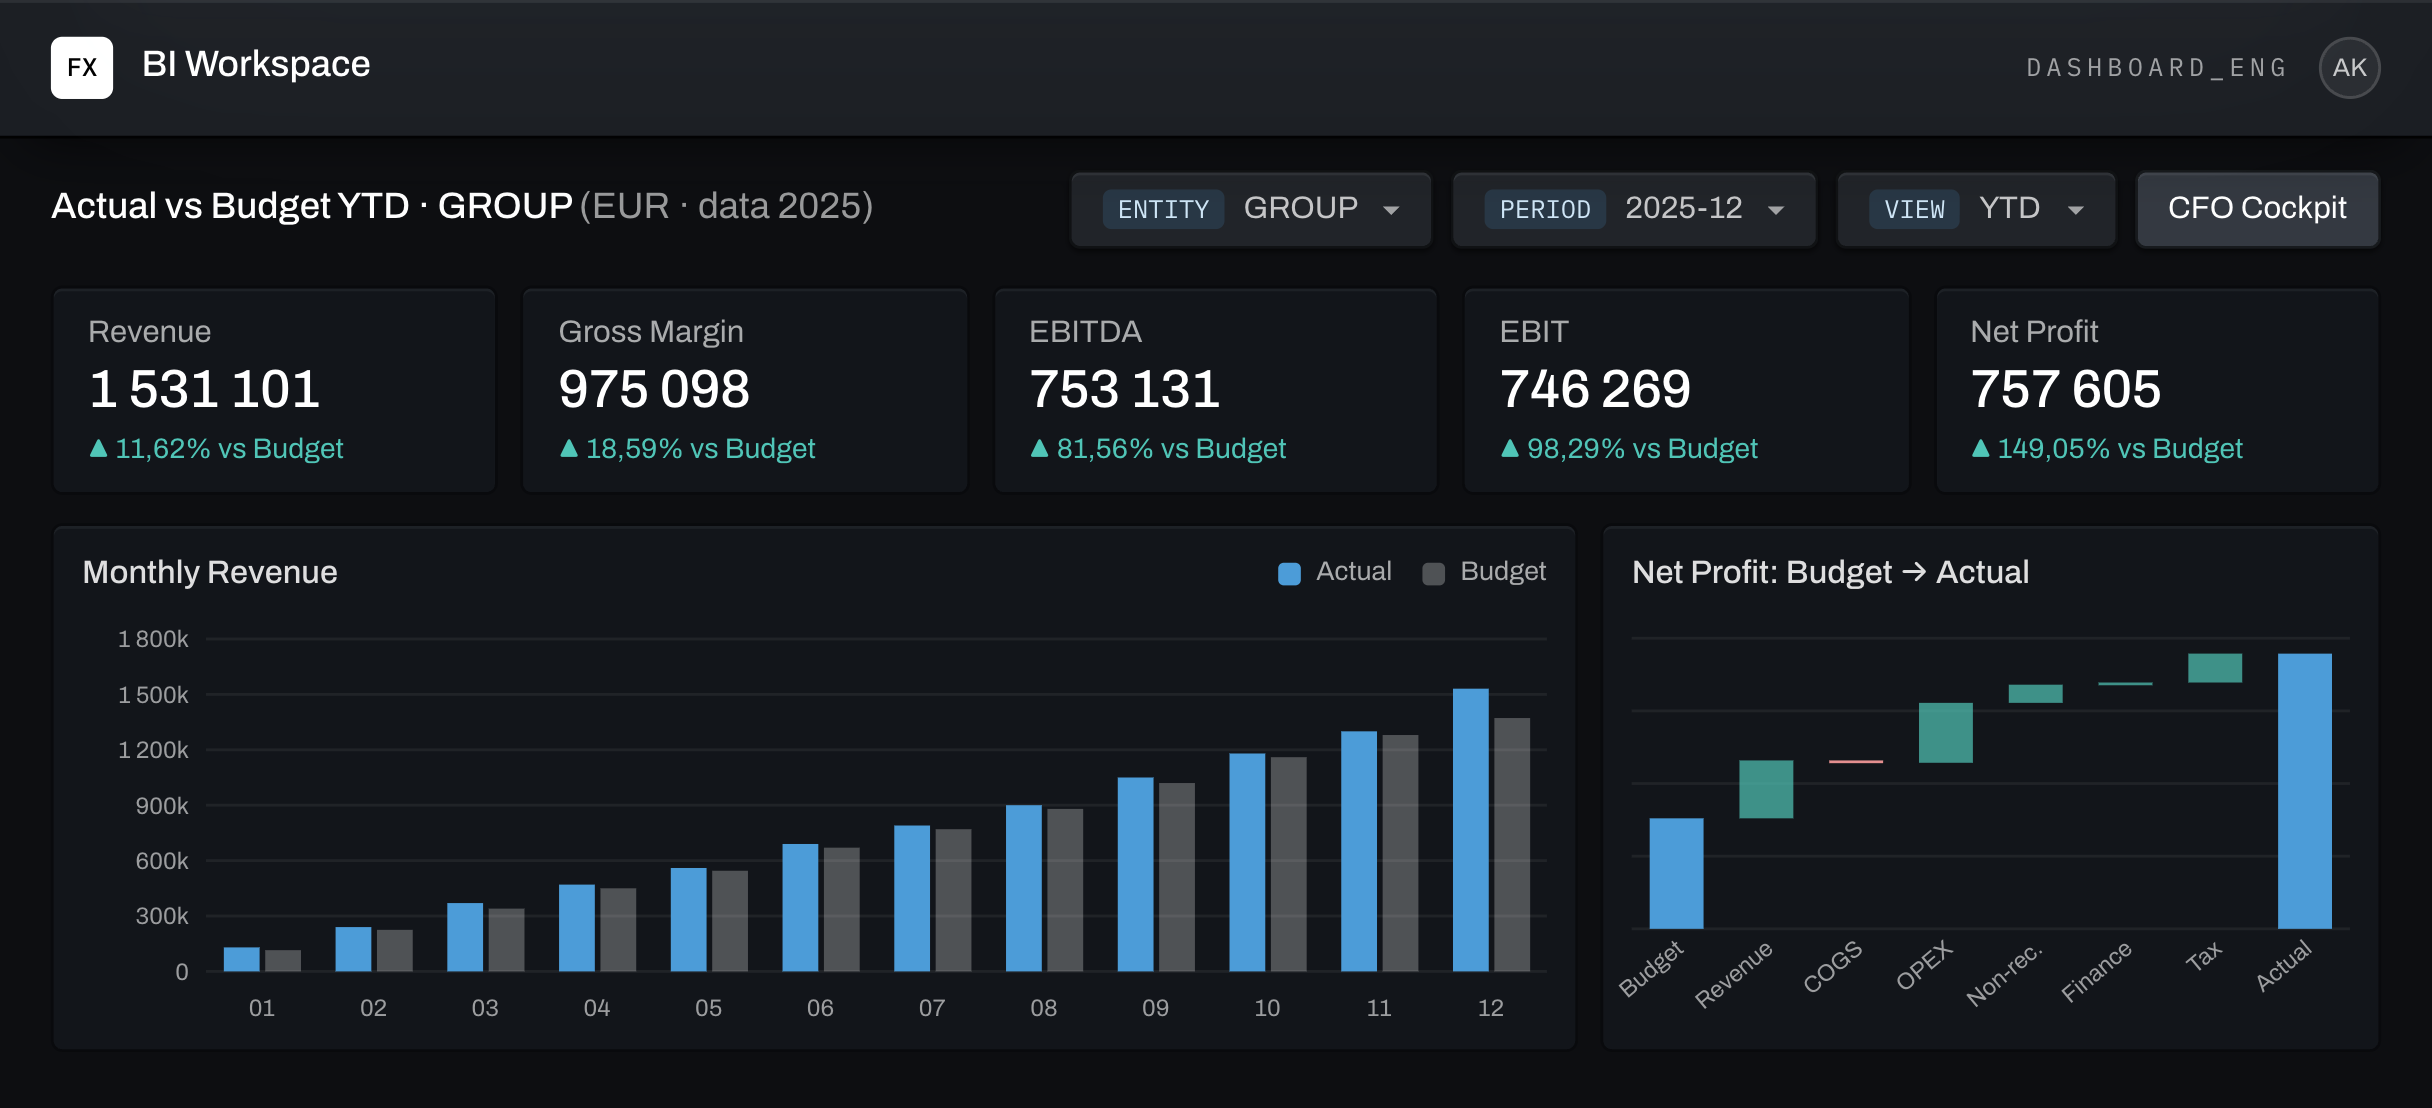
Key results and KPIs in one view.
Reports on financial and operational data.
Actuals and plan in the same report.
Changes in results over successive periods.
Monitoring margin, profitability and liquidity.
Analysis by company, region and product.
Breaking a difference down into the areas that make it up.
From the aggregated amount to the underlying data.
Building analyses for business teams.
The group is PLN 400k below budget. The South accounts for a PLN 600k negative variance, partly offset by surpluses in the North and Central regions.
Revenue · PLN m · illustrative data
In the South region, the largest variance is on product A. Its sales were PLN 450k below plan, which is 75% of the region's gap.
The breakdown shows which products to start with when analyzing the causes of lower sales.
Track revenue, margin and budget performance on the group dashboard.
Compare actuals with the plan and break variances down by area.
Check results by region and product.
See sales value alongside units sold and margin. The report makes it easier to check which products contribute most to results.
Revenue, costs and margin.
Volumes and sales performance.
A consistent scope for reports and comparisons.
Model data available through the Fincorex® Power BI Connector.
Revenue in PLN · illustrative data
Data from accounting and ERP systems, sales (CRM) and HR systems, and Excel files. All data goes into one model, so reports and dashboards show the same numbers.
Yes. You'll see actuals and budget in the same report and can break the variance down by region, product or other breakdowns available in the model.
Yes. Business users can build reports, analyses and dashboards themselves – without knowing complex IT tools. This makes them more independent and shortens the time it takes to get to key information.
Yes. Our Power BI connector makes Fincorex® BI data available in real time, without manual exports. You can combine it with other organizational data and build your own dashboards.
Among others, profitability, liquidity, and debt and capital structure ratios. You can tailor the set of ratios to your company's needs.
Yes. Fincorex® BI supports automatic conversion of Power BI reports, so you don't have to rebuild them from scratch.
It depends on the number of data sources and the reporting scope. The first reports and dashboards can be up and running within a few weeks – we'll agree on the details at a meeting.
As a proof of concept, we’ll rebuild your reporting or planning model in Fincorex® and show it to you at our next meeting.
Book a demo