
Compare group actuals, budget and forecast in a shared model. Analyze results by company and segment, taking intercompany eliminations and currency translation into account.
Company data in an agreed line-item structure.
Scenarios side by side at group level.
Reports in the breakdowns the management board needs.
Analysis by company, subgroup and segment.
Reporting in the currency adopted for the group.
Eliminations according to the model's rules.
Recording adjustments and analyzing their impact on results.
Drilling down from group results to segment details.
Comparing successive budgets and forecasts.
In this example, group results are PLN 1m below budget. The Manufacturing segment has a variance of −PLN 1.3m, partly offset by Services, which beat the plan by PLN 300k.
Results after eliminations · PLN m · illustrative data
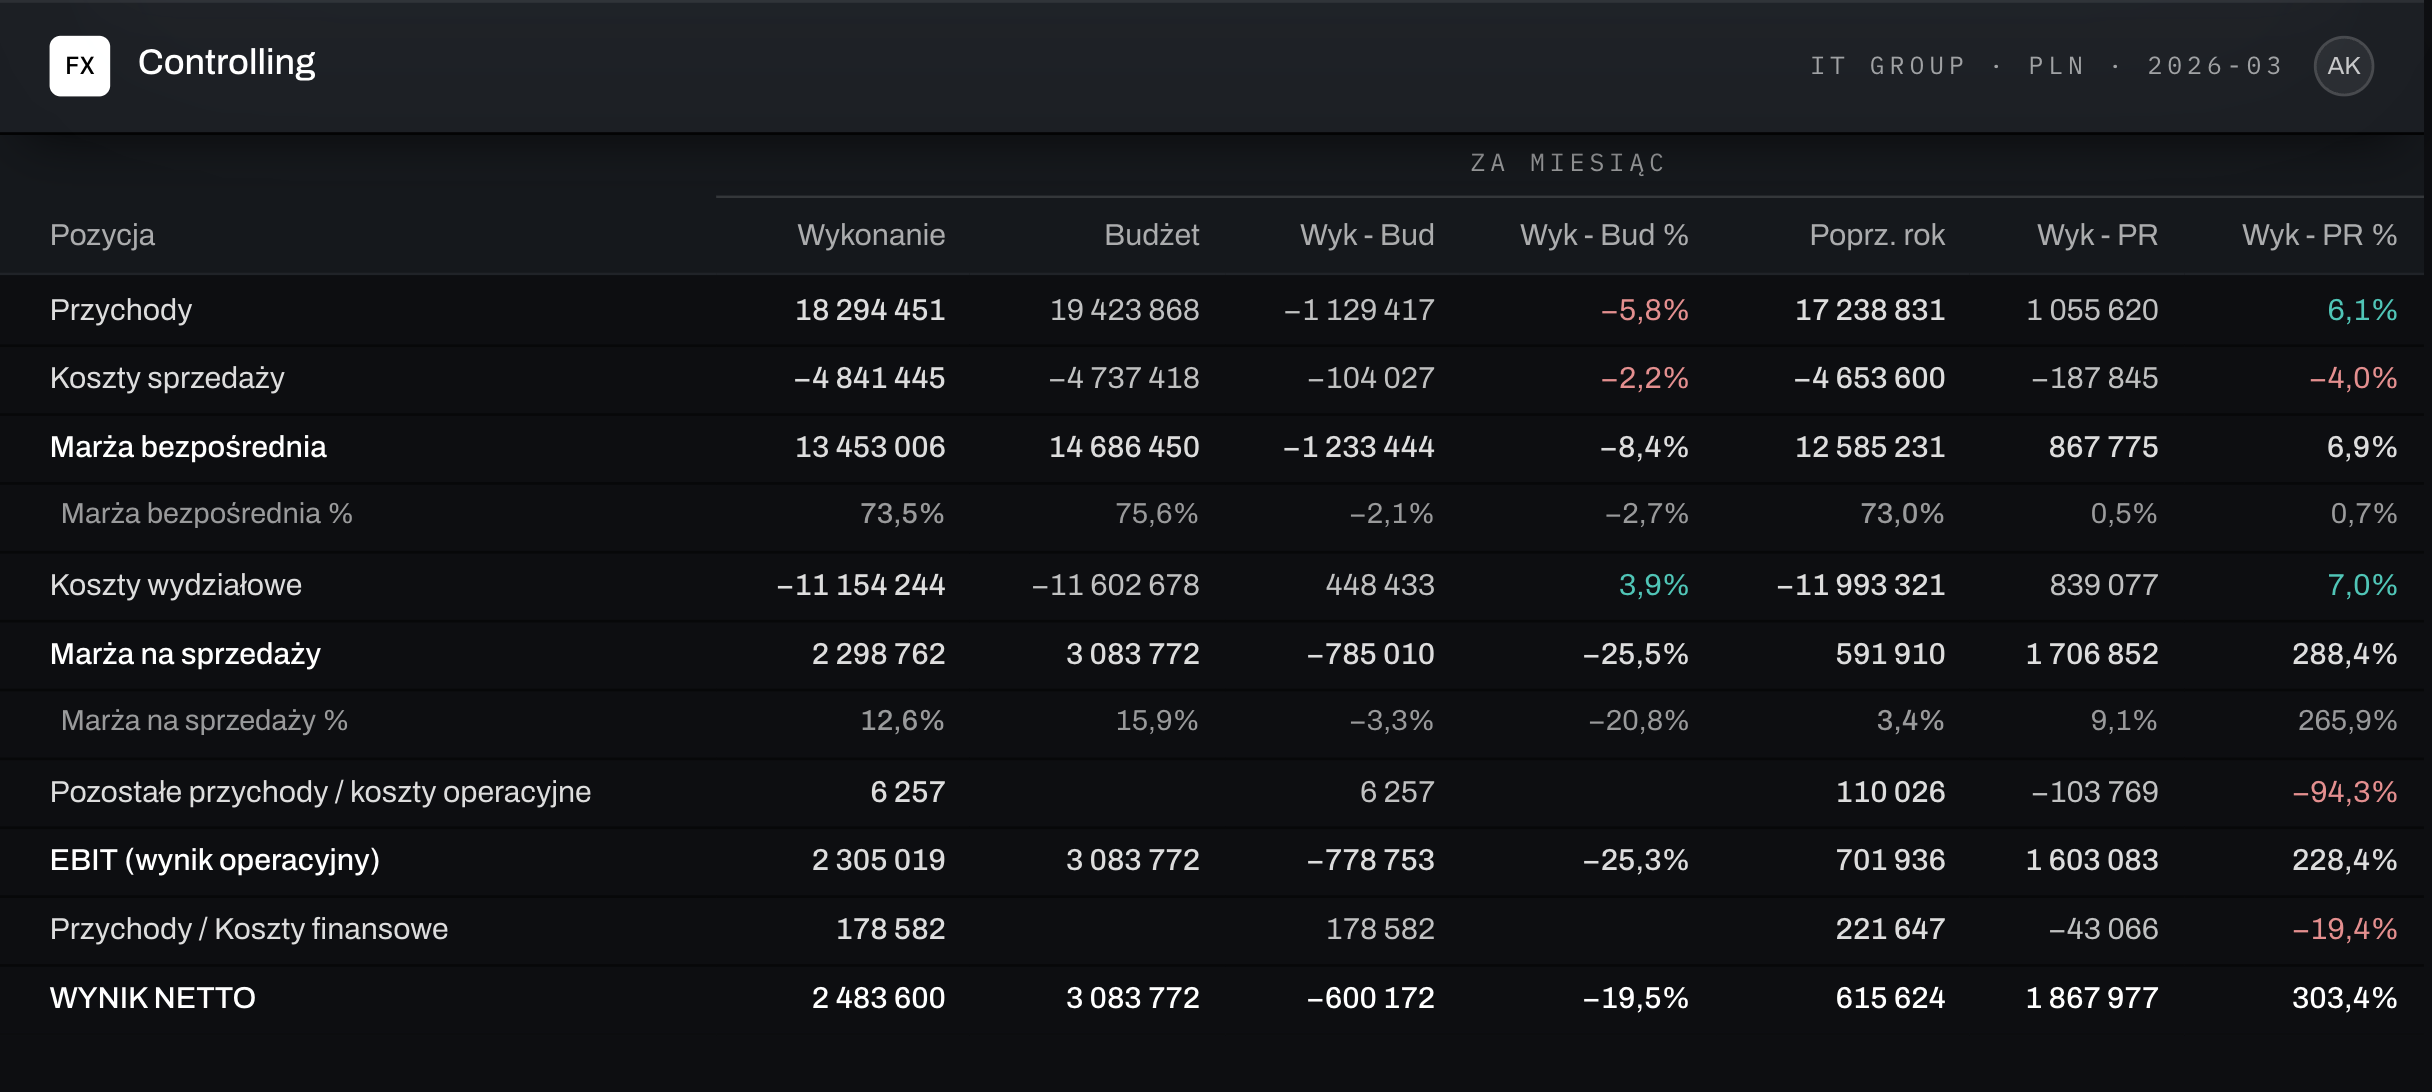
In this sample report, revenue beat the plan by PLN 4m. Costs rose PLN 5m above budget, so operating profit is PLN 1m lower.
Illustrative data after eliminations. All versions cover the same period and group scope.
Compare entity results and their share of group results.
Compare revenue, costs and results by line of business.
Compare actuals, budget and forecast in the same reporting currency.
Analyze the income statement, balance sheet and cash flows in a management layout. Compare actuals with the plan for the group, a subgroup or a selected segment.
A common scope of data submitted by the companies.
Group and segment results in Fincorex® BI or Power BI.
Integration of accounting, ERP, sales and HR systems and Excel.
Visibility into adjustments and their impact on group results.
Sample report layout · illustrative data
Results for the whole group in the layout the management board needs – by company, subgroup and segment, after intercompany eliminations and currency translation.
Yes. Group actuals, budget and forecast are in the same model, so you can compare them for the same period and group scope.
The line-item structure and measurement policies can follow the IFRS standards adopted by the group, and management reports use the same reconciled data.
Yes. Company data is translated into the group currency, and intercompany transactions are eliminated according to the model's rules.
Yes. You can break down revenue, costs and results by business segment and compare them with the plan.
As a proof of concept, we’ll rebuild your reporting or planning model in Fincorex® and show it to you at our next meeting.
Book a demo